Figure 3.

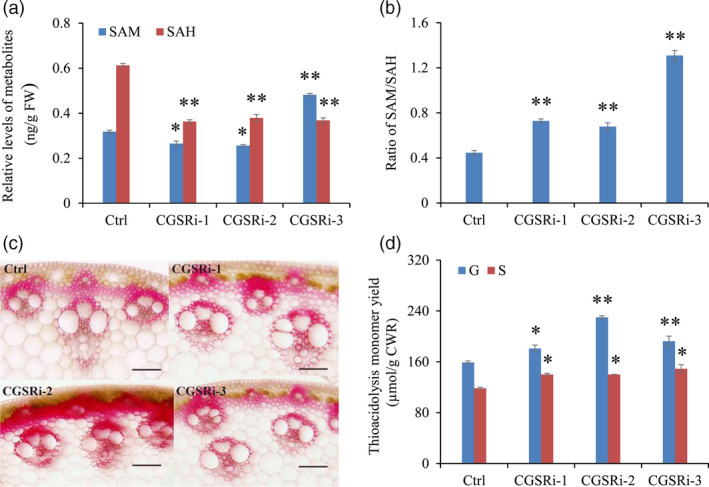
The effects of CGS down‐regulation on C1 metabolites and lignin biosynthesis in switchgrass. (a) The contents of SAM and SAH in control and transgenic switchgrass plants. (b) The ratios of SAM/SAH in control and transgenic switchgrass plants. The control plants (Ctrl) for CGS‐RNAi transgenic lines were generated with pANIC8B empty vector. (c) Cross sections of the I2 internodes from transgenic switchgrass plants. The control plants were generated with pANIC8B empty vector. Stem at E4 stage was collected, and the different internodes were separated. Cross sections from three independent I2 internodes were used for histochemical assay. Two technical replicates were conducted. Bars = 0.1 mm. (d) G and S lignin monomer yield of the CGS‐RNAi transgenic lines. The control plants (Ctrl) were generated with pANIC8B empty vector. Stems at E4 stage were collected. FW, fresh weight; CWR, cell wall residue. Value are mean ± SE (n = 3). One or two asterisks indicate significance corresponding to P < 0.05 or 0.01 (one‐way ANOVA Dunnett's test).
