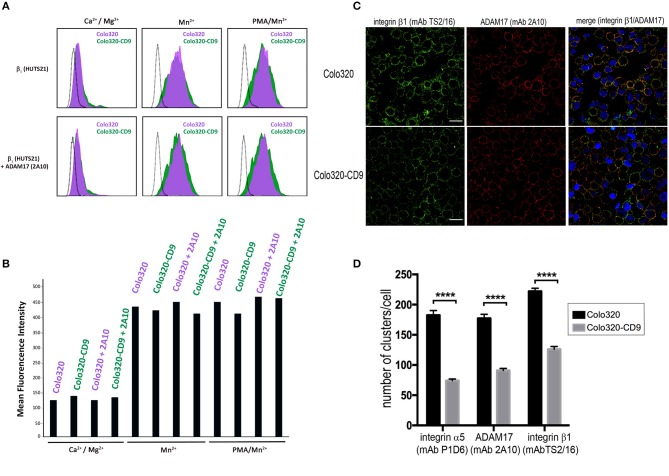
Figure 4.
CD9-induced inhibition of integrin α5β1-mediated cell adhesion does not involve alterations of integrin affinity. (A) Flow cytometric analysis of the expression of epitope HUTS21 in different integrin activation conditions: Ca2+/Mg2+ (0.5 mM/1mM, respectively), Mn2+ (200 μM) or PMA/Mn2+ (200 ng/ml/200 μM, respectively) in Colo320 (purple-filled histograms) and Colo320-CD9 (green-filled histograms). The lower row of histograms represents the effect of cell pre-incubation with the mAb 2A10 on the expression of HUTS21 epitope in Colo320 and Colo320-CD9 cells. The black dotted line histograms correspond to negative controls. The fluorescence of 2,000 cells was acquired in the flow cytometer for each histogram. (B) Expression of HUTS21 epitope represented as the mean florescence intensities from the flow cytometry histograms shown in (A). (C) Double immunofluorescence staining and confocal microscopy analysis showing the effects of CD9 expression on the organization of integrin α5β1 (green) and ADAM17 (red) molecules on the surface of Colo320 cells. Colo320 and Colo320-CD9 cells were stained with the anti-β1 (TS2/16) or anti-ADAM17 (2A10) mAbs. Representative images of confocal sections are shown. Scale bar = 20 μm. (D) Quantitation of the number of clusters/cell of integrin α5, β1, and ADAM17 molecules on the surface of Colo320 and Colo320-CD9. Graph shows the means ± SEM of the number of clusters/cell, calculated from at least 350 different cells for each condition using the Image-J thresholding and particle analyses.****denotes p < 0.0001 in a one-way ANOVA with Tukey's post-test.

