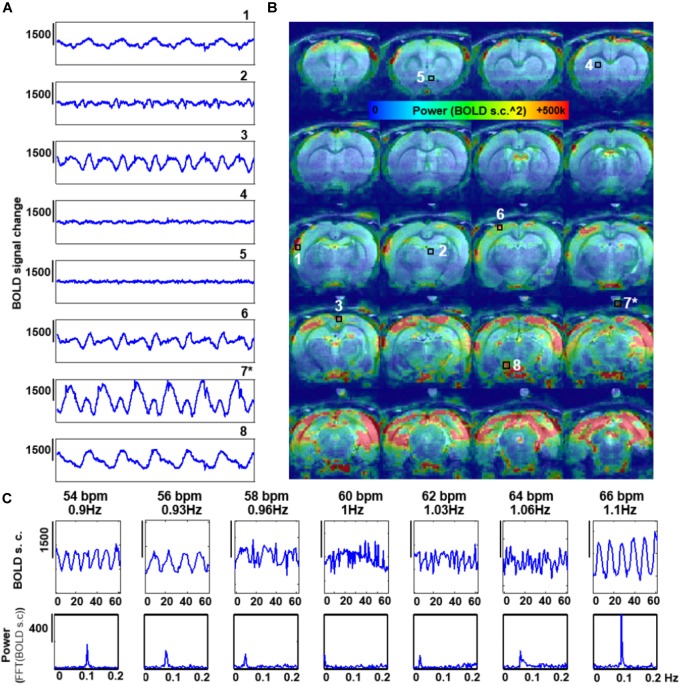
FIGURE 4.
Effect of the rate of artificial ventilation on the fMRI time-course. (A) The graphs show 300 s of fMRI time course from 8 different voxels, extracted from a 3D EPI in an animal ventilated at 59 bpm (0.96 Hz) (TR = 1 s). Numbers indicate the location of the voxels (see C). (∗) indicates a phantom voxel (registration is not perfect due to misalignment between the anatomical and functional scan). (B) The map shows the distribution of the power of frequencies in the range 0.005–0.4 Hz. (C) fMRI time courses acquired with TR = 1s in a non-paralyzed animal ventilated at seven different rates.

