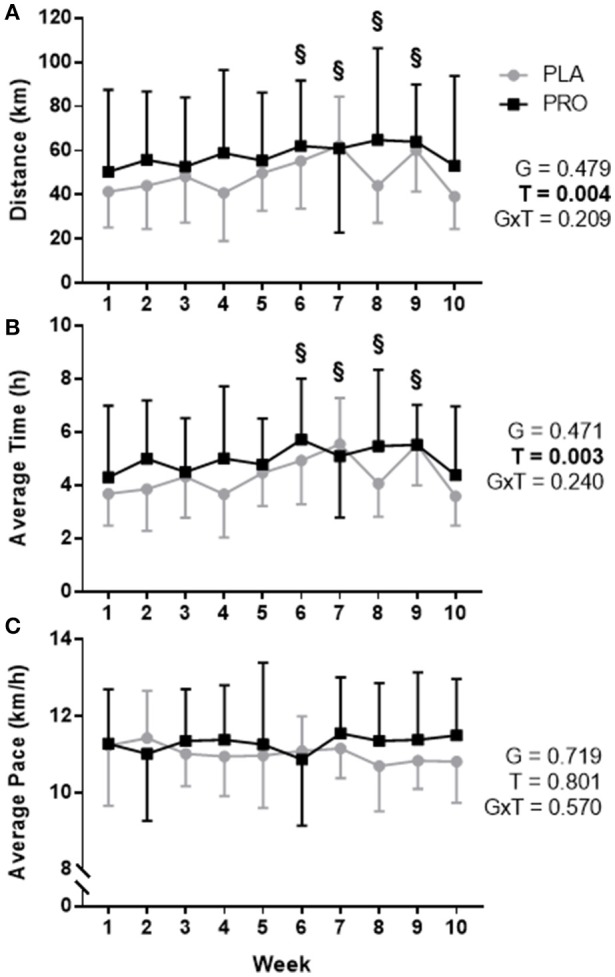
Figure 1.

Training data represented as mean ± SD. “G” = group effect p-value, “T” = time effect p-value, “G×T” = group × time interaction p-value. (A) Average distance (km) run per week for the placebo group (PLA; gray) and protein group (PRO; black). There was not a significant group by time interaction or group effect (p > 0.05), however, there was a time effect (p < 0.05) whereby pairwise comparisons determined a significant difference between week 1 and weeks 6, 7, 8, and 9 (“§”, p < 0.05). (B) Average hours spent running per week for each group. A significant time effect existed (p < 0.05) whereby pairwise comparisons determined differences between week 1 and weeks 6, 7, 8, and 9 (“§”, p < 0.05). (C) Average pace for each group was not significantly different (p>0.05). Volume was increased weeks 1–3, 5–7, and 9, and weeks 4 and 8 were recovery weeks. Week 10 was a taper leading into post testing. Forced independent t-tests were conducted at each time point to determine any possible group differences and revealed no significant differences (p > 0.05).
