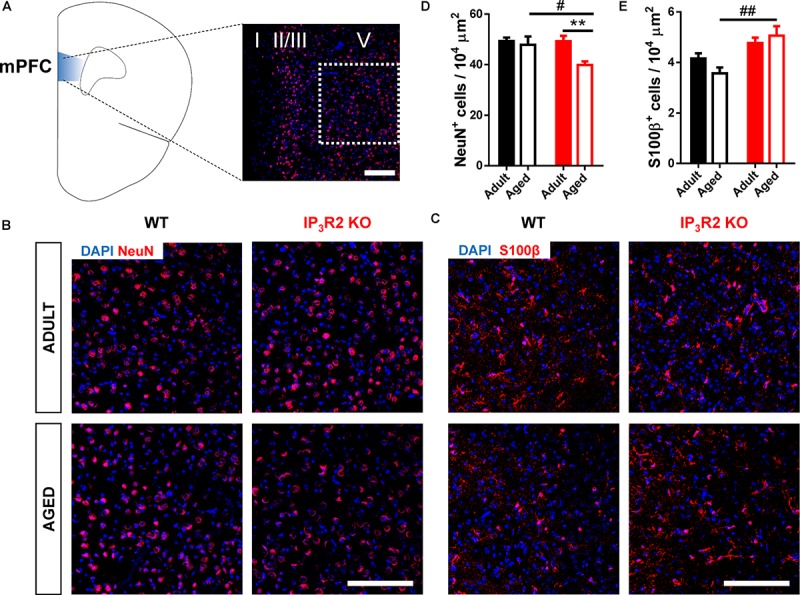
FIGURE 2.

Aged IP3R2 KO mice display decreased NeuN+ neuron densities and increased S100β+ astrocyte densities. (A) Scheme of the prelimbic subregion of the medial prefrontal cortex (mPFC, blue) and respective layers I, II/III, and V. mPFC layer V (white dash line) corresponds to the area considered for cell counting. (B) Representative mPFC layer V confocal images of DAPI/NeuN labeling for WT and IP3R2 KO mice (adult and aged). (C) Representative mPFC layer V confocal images of DAPI/S100β labeling for WT and IP3R2 KO mice (adult and aged); (A–C) scale bars = 200 μm. (D,E) Densities of NeuN+ (D) and S100β+ (E) cells in mPFC layer V of WT and IP3R2 KO mice (adult and aged; n = 8–15 images per group; two-way ANOVA, Sidak’s multiple comparisons test). WT (adults and aged) mice are represented in filled/unfilled black bars, whilst IP3R2 KO (adults and aged) are represented in filled/unfilled red bars. Data plotted as mean ± SEM. #p < 0.05 and ##p < 0.01 between genotypes and ∗∗p < 0.01 between ages.
