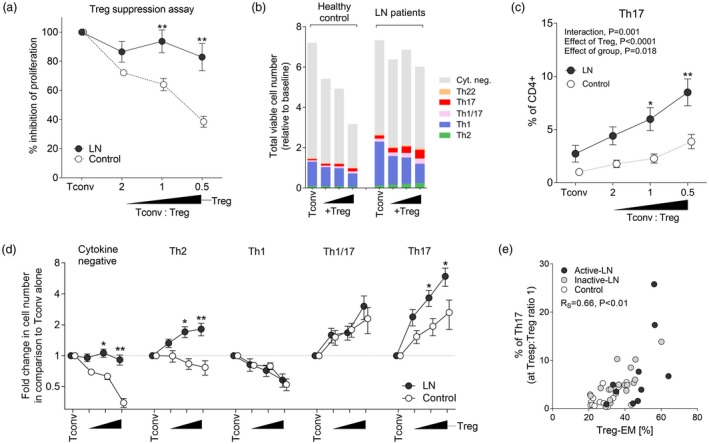
Figure 3.

Regulatory T cell (Treg) suppression in lupus nephritis (LN). (a) Suppression assay. Activated (aCD3/aCD28) CD4+CD25– (Tconv) and CD4+CD25+ (Treg) cells were cultured for 5 days at different ratios (triangle). Results are presented as % inhibition of proliferation (compared to Tconv alone). LN data were combined, as there was no difference between active and inactive patients. **P < 0·01 compared to control subjects. (b) Influence of Treg on CD4+ T cell proliferation and cytokine production. Stacked graph summarizes change in numbers of cytokine‐producing Tconv cells (neg. = cytokine negative) at day 5 compared to baseline (day 0). Experimental setup as in (a). (c) Percentage of T helper type 17 (Th17) cells in CD4+ T cell cultures (day 5) in LN patients (data combined) and control. Two‐way analysis of variance (anova) statistics and post‐hoc tests: *P < 0·05, **P < 0·01 in comparison to the control group. (d) Fold change in the number of cytokine producing CD4+ T cell subsets at different Tconv : Treg ratios [as in (a)]. Data were standardized to experimental control (Tconv alone). *P < 0·05, **P < 0·01 compared to control group (anova and post‐hoc test). (e) Correlation between the percentage of effector memory (EM) Treg cells and the fraction of Th17 cells in the cell culture at a 1 : 1 Tconv:Treg ratio.
