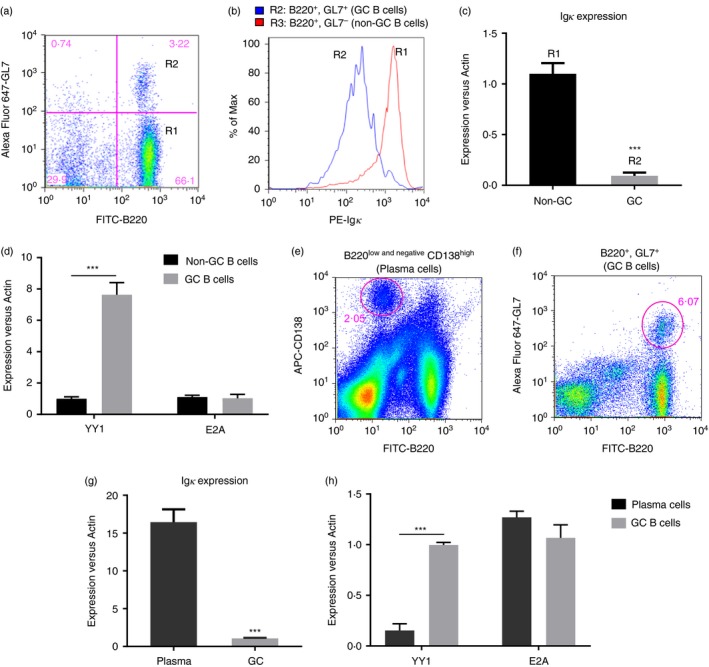
Figure 4.

Igκ expression is down‐regulated in germinal centre (GC) B cells. (a) A single‐cell suspension was prepared from Peyer's patch lymph nodes and analysed with FACS using fluorescein isothiocyanate (FITC) ‐labelled B220, phycoerythrin (PE) ‐labelled Igκ and Alex‐Fluor‐647‐labelled GL7. The FACS assay readily distinguished the non‐GC B cells (B220+ GL7−, R1) from the GC B cells (B220+ GL7+, R2). (b) The fluorescence intensity of the surface Igκ on the non‐GC B cells from the GC B cells was measured, and the results indicated that the GC B cells expressed less Igκ than the non‐GC B cells. (c) The GC and non‐GC cells were sorted by FACS, and real‐time PCR was performed to measure the mRNA levels of Igκ, YY1 and E2A. The expression of Igκ was down‐regulated in the GC B cells compared with that in the non‐GC B cells (***P < 0·001, GC B cells versus non‐GC B cells). (d) In contrast, the expression of YY1 was significantly higher in GC B cells compared wth that in non‐GC B cells. No difference in E2A expression was observed between the two populations (***P < 0·001, GC B cells versus non‐GC B cells). (e, f) To prepare the splenic plasma and GC B cells, a single‐cell suspension was prepared from the spleen collected 5 days post‐immunization with sheep red blood cells (SRBCs), and the cells were stained with FITC‐B220 plus APC‐CD138 or FITC‐B220 plus Alex‐Fluor‐647‐labelled GL7. The plasma cells (B220low and negative CD138high) and GC B cells (B220+ GL7+) were sorted by FACS according to their surface markers. (g) Real‐time PCR indicated that Igκ expression was markedly increased in plasma cells compared with that in GC B cells (***P < 0·001, plasma cells versus GC B cells). (h) The plasma cells expressed less YY1 than the GC B cells, whereas there was no difference in the levels of E2A between the two populations (***P < 0·001, plasma cells versus GC B cells).
