
Figure 8.
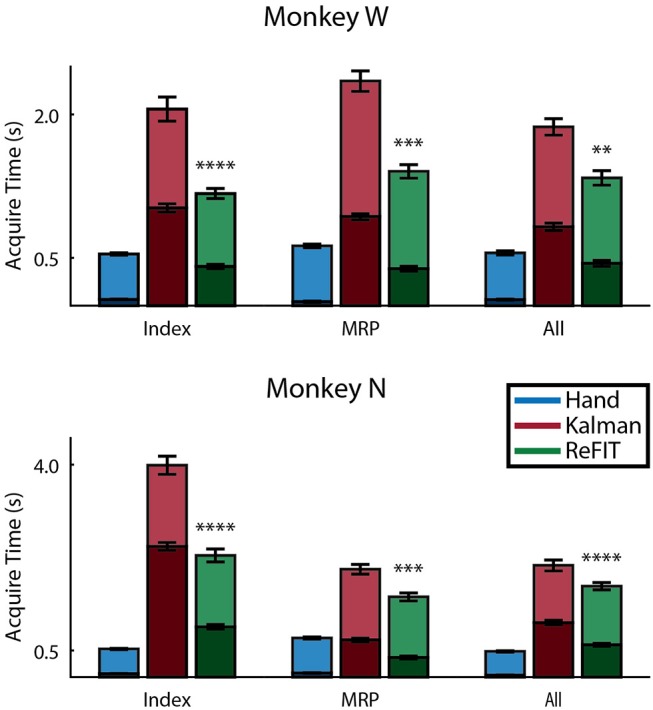
Online performance of center-out target task. Bar graphs indicate average acquisition time (mean ± s.e.m.), with the darkened region scaled to represent the average fraction of each trial spent orbiting (mean ± s.e.m.) across two sessions for each subject. Stars indicate a significant improvement in the orbiting behavior of ReFIT over the initial Kalman filter (one-sided two sample t-test, n ≈ 300 trials; with **p < 0.001, ***p < 1 × 10⁻⁴, and ****p < 1 × 10⁻⁶).