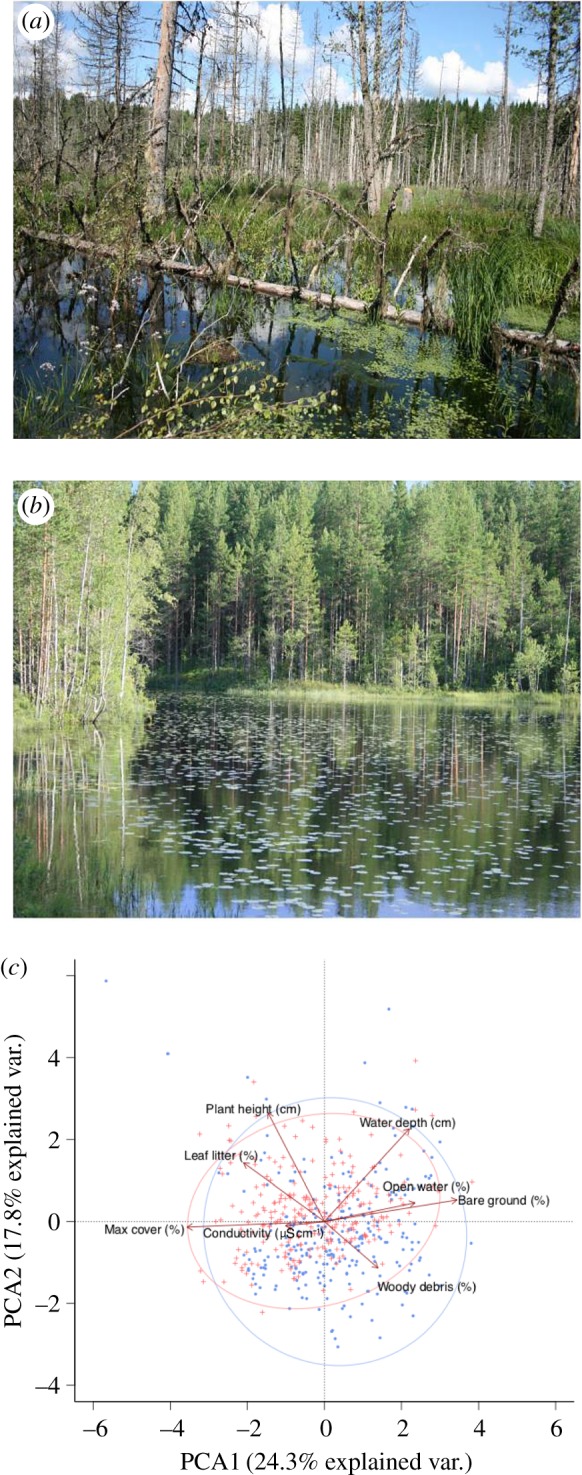
Figure 1.

Examples of a beaver pond (a) and other wetland (b) within the study area. Principal components analysis (PCA) of plot level environmental data collected in beaver ponds (blue) and other wetlands (red). Ellipses cover 95% of the variation in scores for each wetland type on the PCA axes shown (c). (Online version in colour.)
