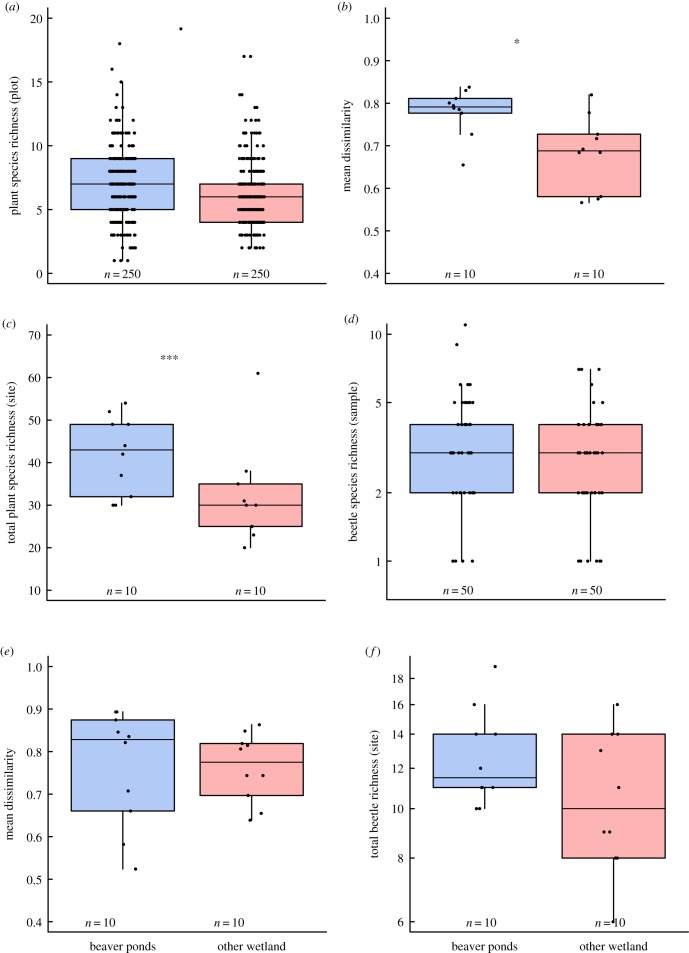
Figure 2.
Boxplots comparing beaver ponds (blue) and other wetlands (red) in terms of (a) alpha diversity of plants (richness per plot); (b) beta diversity of plants (Bray Curtis dissimilarity); (c) gamma diversity of plants (richness per site); (d) alpha diversity of beetles (richness per sweep); (e) beta diversity of beetles; (f) gamma diversity of beetles. Boxes show median and enclose interquartile range, whiskers show 10th and 90th percentiles. Dots show individual data points. ▪ p < 0.01; *p < 0.05; ***p < 0.001. (Online version in colour.)

