Figure 3.
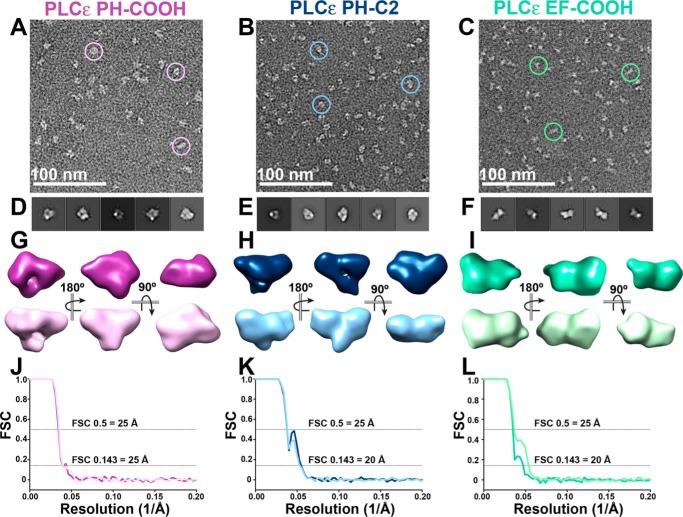
Single-particle negative stain EM reconstructions confirm elongated conformations in PLCϵ variants. A–C, raw, unadjusted micrograph field views with examples of picked particles (circles) for PLCϵ PH-COOH (A), PH-C2 (B), and EF-COOH (C). D–F, the top five reference-free 2D class averages for PH-COOH (D), PH-C2 (E), and EF-COOH (F) variants. G, two representative, refined 3D models of PH-COOH, with the top purple model generated from 9,879 particles and bottom orchid model generated from 13,628 particles. H, representative models of PH-C2, with the top navy model generated from 24,129 particles and the bottom sky blue model generated from 22,343 particles. I, representative models of EF-COOH, with the top sea foam green model generated from 13,416 particles and the bottom lime green model generated from 14,498 particles. J–L, FSC curves for refined 3D models of PH-COOH, PH-C2, and EF-COOH, respectively. The gold-standard FSC (0.143) for all models indicates a final resolution of 25, 20, and 20 Å, respectively. FSC curves reflect the cross-correlation coefficient from aligning two independent half-maps. A representative workflow for the PLCϵ PH-COOH variant, containing A, D, and G, is shown in Fig. S5.

