Figure 6.
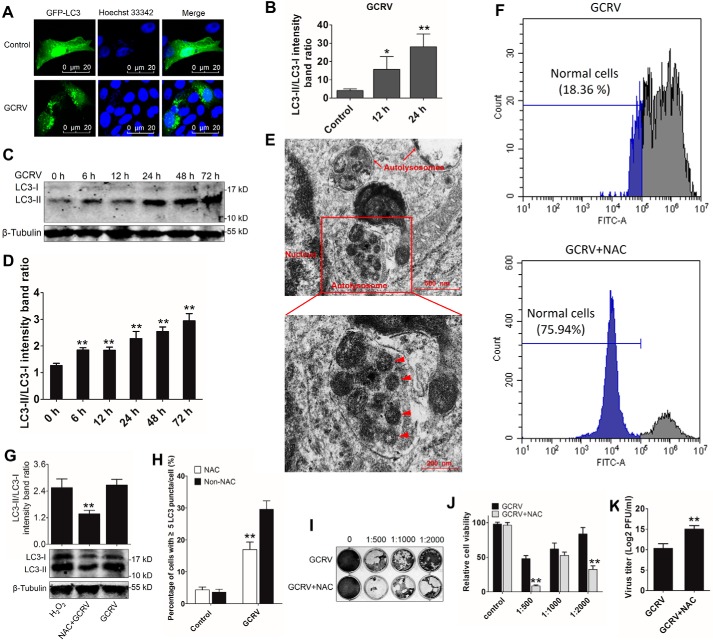
GCRV infection promotes autophagy activation in CIK cells. A, imaging of GFP-LC3–labeled autophagosomes induced by GCRV infection. CIK cells were transfected with GFP-LC3 for 16 h and infected with GCRV for another 24 h. Then the cells were fixed and stained for confocal microscopy. B, quantifying the percentage of cells with at least 5 GFP-LC3–positive puncta per cell. Mean ± S.D.; **, p < 0.01 compared with GFP-LC3–transfected cells. C and D, analyses of the ratios of LC3-II/LC3-I upon GCRV infection. CIK cells were infected with GCRV. The cell lysate was used for WB examination with anti-LC3 and β-tubulin Abs at different time points after infection. The intensity of LC3-II/LC3-I was analyzed by ImageJ (**, p < 0.01). E, observation of autolysosomes in GCRV-infected CIK cells using TEM. CIK cells were fixed 48 h after GCRV infection and observed under a transmission electron microscope. The red arrowheads indicate virus particles wrapped in autolysosomes. F, NAC inhibits GCRV-induced ROS accumulation in CIK cells. CIK cells were pretreated with or without NAC for 0.5 h before GCRV infection. Twenty-four hours later, the cells were supplied with the DCFH-DA probe in supernatants according to the ROS assay kit, and the oxidized cells were examined by flow cytometry. G and H, NAC restrains autophagy activation. G, CIK cells were pretreated with NAC for 0.5 h and then treated with H2O2 or infected with GCRV for 24 h. The cell lysate was subjected to WB analysis with anti-LC3 Ab. The ratio of LC3-II/LC3-I was analyzed by ImageJ (**, p < 0.01). H, the autophagosomes were quantified by the percentage of cells with at least five GFP-LC3–positive puncta per cell. Mean ± S.D.; **, p < 0.01 compared with GFP-LC3–transfected cells. I–K, NAC inhibits GCRV replication. I, standard plaque assay. CIK cells were plated in 24-well plates for 12 h and treated with titer samples of GCRV and GCRV+NAC at different dilution rates (0, 1:500, 1:1000, and 1:2000). Thirty-six hours later, viable cells were fixed with 10% paraformaldehyde and stained with 0.05% (w/v) crystal violet. J, cell viability was assessed by MTT assay in 96-well plates. K, virus titer supernatants were measured by PFU assay. Error bars indicate standard deviation (n = 4). **, p < 0.01; *, 0.01 < p < 0.05.

