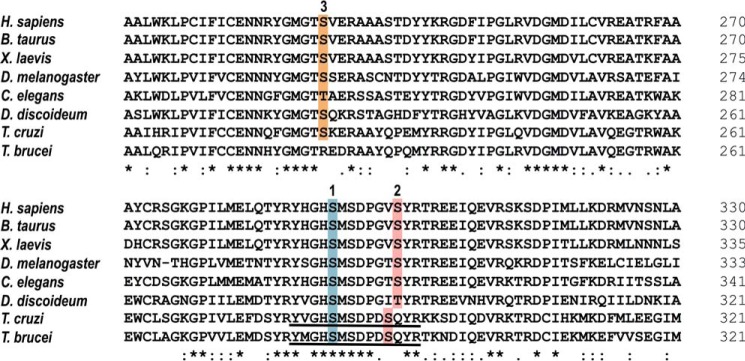
Figure 1.
Phosphorylation sites of PDH E1α orthologs. Shown is an amino acid sequence comparison of PDH E1α orthologs across several species, where putative phosphorylation sites 1 (blue), 2 (pink), and 3 (orange) are highlighted. Sequence of the phosphopeptides used as substrates in PDP activity assays are underlined in T. cruzi and T. brucei orthologs. Accession numbers: Homo sapiens (NP_000275.1), Bos taurus (NP_001094516.1), Xenopus laevis (AAI06671.1), Drosophila melanogaster (NP_726946.1), Caenorhabditis elegans (NP_871953.1), Dictyostelium discoideum (XP_629349.1), T. cruzi (XP_814071.1), and T. brucei (XP_823475.1). Protein alignment was performed using Clustal Omega (https://www.ebi.ac.uk/Tools/msa/clustalo/) (81) (Please note that the JBC is not responsible for the long-term archiving and maintenance of this site or any other third party hosted site.). Asterisk indicates positions which have a single, fully conserved residue; colon indicates conservation between groups of strongly similar properties (Clustal scoring >0.5); period indicates conservation between groups of weakly similar properties (Clustal scoring ≤0.5).

