Figure 1.

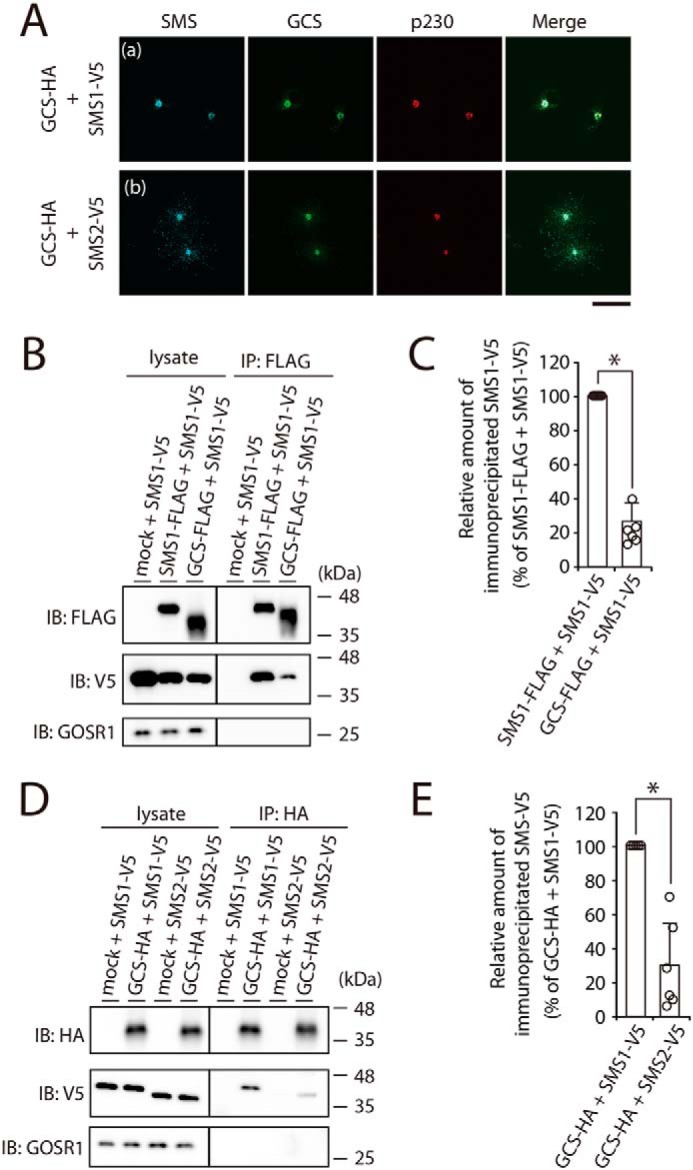
SMS1 forms a heteromeric complex with GCS. A, COS7 cells were transfected with the following combinations of plasmids: HA-tagged GCS and V5-tagged SMS1 or V5-tagged SMS2. At 24 h post-transfection, the cells were co-stained with anti-V5 and anti-HA antibodies, followed by appropriate Alexa Fluor–conjugated secondary antibodies, and analyzed by confocal microscopy. Localization was confirmed by co-staining with antibody against the trans-Golgi network marker p230. Blue, SMS1 and SMS2; green, GCS; red, p230. Scale bar, 50 μm. The results shown are from one experiment representative of three independent experiments. B and C, COS7 cells were transfected with the following combinations of plasmids: FLAG-tagged SMS1, FLAG-tagged GCS, or mock (empty vector) and V5-tagged SMS1. At 24 h post-transfection, the cells were lysed in a buffer containing 1% CHAPS, and immunoprecipitation was performed using an anti-FLAG affinity gel. B, cell lysates and precipitated proteins were analyzed by immunoblotting (IB) with anti-FLAG, anti-V5, or anti-GOSR1 antibody. Left panel, cell lysate; right panel, immunoprecipitate (IP). C, the quantities of V5-tagged SMS1 precipitated with the FLAG-tagged SMS1 or FLAG-tagged GCS are represented as the ratio of the band intensities. The values represent the means ± S.D. from six independent experiments. *, p < 0.01. D and E, COS7 cells were transfected with the indicated combination of plasmids. Proteins from cell lysates were immunoprecipitated using an anti-HA affinity gel. D, cell lysates and precipitated proteins were analyzed by immunoblotting with anti-HA, anti-V5, or anti-GOSR1 antibody. E, the quantities of V5-tagged SMS1 or V5-tagged SMS2 precipitated with HA-tagged GCS were represented as the ratio of the band intensities. The values represent the means ± S.D. from six independent experiments. *, p < 0.01.
