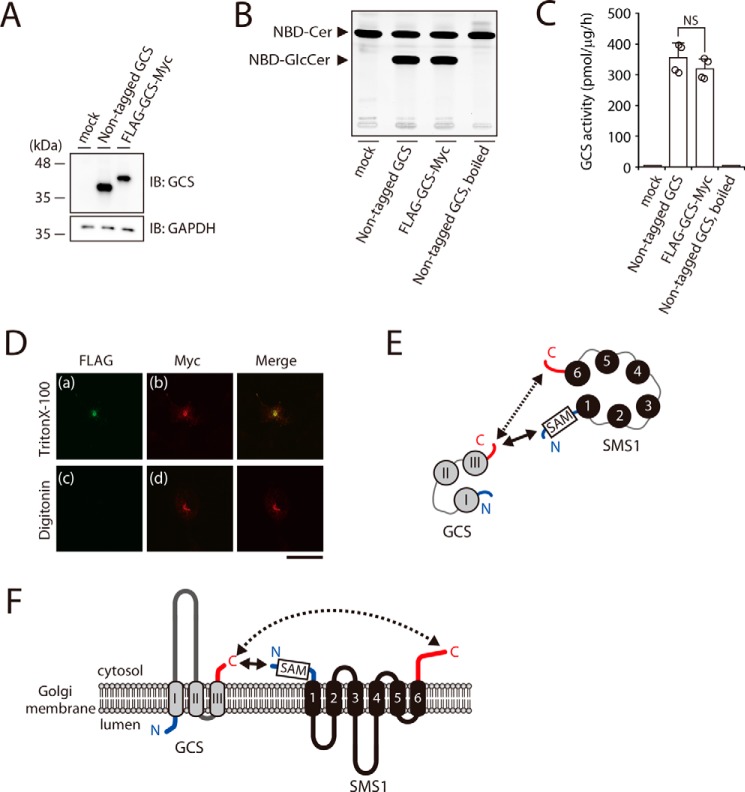
Figure 3.
The N terminus of SMS1 and the C terminus of GCS face the cytosolic side of the Golgi apparatus. A–C, GCS KO#1 cells were transfected with the indicated plasmids. All cells were lysed and analyzed by immunoblotting with anti-GCS antibody. Anti-GAPDH was used as a loading control. The blots are from one experiment representative of four independent experiments. B and C, assays for GCS activity in vitro. Cell lysates were incubated with C6–NBD–Cer in the presence of UDP–Glc. The values represent the means ± S.D. from four independent experiments. NS, not significant. D, COS7 cells were transfected with plasmid encoding FLAG–GCS–Myc. After fixation and permeabilization with 0.1% Triton X-100 (upper panel) or 0.002% digitonin (lower panel), the cells were co-stained with anti-FLAG and anti-Myc antibodies followed by individual Alexa Fluor–conjugated secondary antibodies and were analyzed by confocal microscopy. Green, N-terminal FLAG; red, C-terminal Myc. Scale bar, 50 μm. The results shown are from one experiment representative of three independent experiments. E and F, cartoon representations of the SMS1–GCS heteromer viewed from the cytosolic space (E) and from a section through the Golgi membrane (F). SMS1 and GCS have the following proximity structures: the solid arrows show the relatively close proximal segment between the N terminus of SMS1 and the C terminus of GCS, and the dashed arrows show the relatively long proximal segment between the C terminus of SMS1 and the C terminus of GCS. The transmembrane segments of SMS1 and GCS are shown in black and gray, respectively. N and C termini are represented by blue and red lines, respectively. Numbers 1–6 and I–III show the transmembrane helices. SAM in a box represents the SAM domain.

