Figure 8.
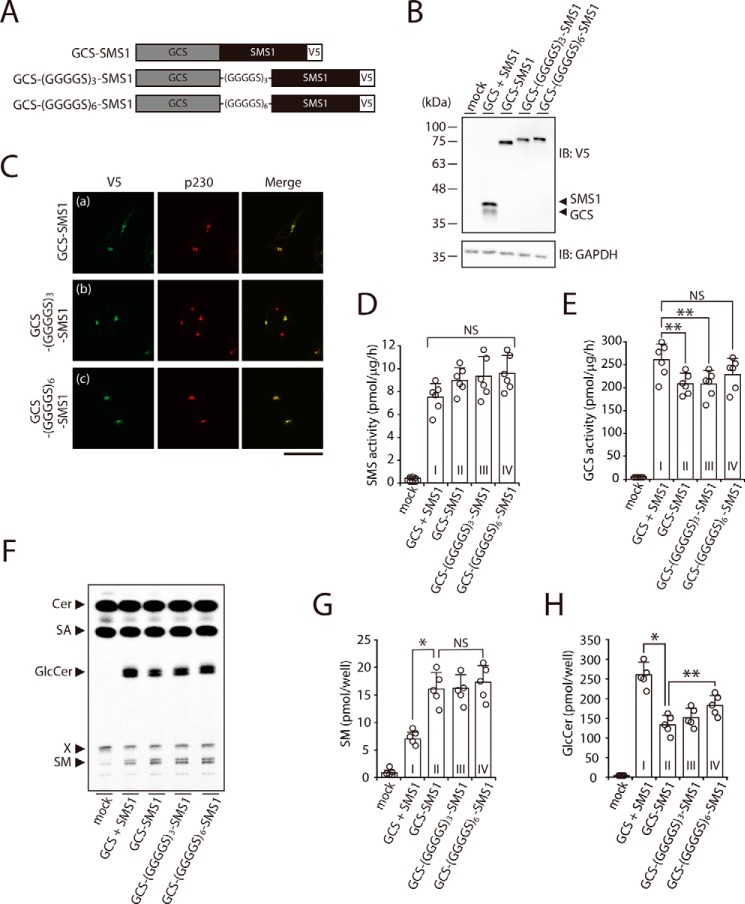
Augmented heteromeric formation by direct fusion of SMS1 and GCS increases SM synthesis but decreases GlcCer synthesis. A, schematic representation of the fusion proteins. Constructs for expression of GCS–SMS1, GCS–(GGGGS)3–SMS1, and GCS–(GGGGS)6–SMS1 fusion proteins were engineered to connect the C terminus of GCS to the N terminus of SMS1 directly or with glycine-rich flexible linkers of different lengths. The locations of V5 tags are indicated. B-H, SMS1–GCS DKO cells were transfected with the indicated plasmids. The amount of plasmid was adjusted so that each protein was expressed at nearly the same level. B, all cells were lysed and analyzed by immunoblotting (IB) with anti-V5 antibody. Anti-GAPDH was used as a loading control. The blots are from one experiment representative of three independent experiments. C, immunocytochemistry analysis. All cells were stained with anti-V5 antibody, followed by appropriate Alexa Fluor–conjugated secondary antibodies, and analyzed by confocal microscopy. Localization was confirmed by co-staining with antibody against the trans-Golgi network marker p230. Green, GCS–SMS1, GCS–(GGGGS)3–SMS1 and GCS–(GGGGS)6–SMS1; red, p230. Scale bar, 50 μm. The images are from one experiment representative of three independent experiments. D and E, assay for SMS (D) and GCS (E) activities in vitro. Cell lysates were incubated with C6–NBD–Cer in the absence (D) or presence of UDP–Glc (E). The values represent the means ± S.D. from six independent experiments. F–H, assay for SMS (F and G) and GCS (F and H) activities in vivo by metabolic labeling. The cells were cultured in medium containing 0.5 μCi of [14C]stearic acid (SA) for 3 h. The lipids were extracted, saponified, and separated by TLC (F). The amount of SM (G) and GlcCer (H) were calculated from the standard curve of [14C]stearic acid. The values represent the means ± S.D. from five independent experiments. *, p < 0.01; **, p < 0.05; NS, not significant.

