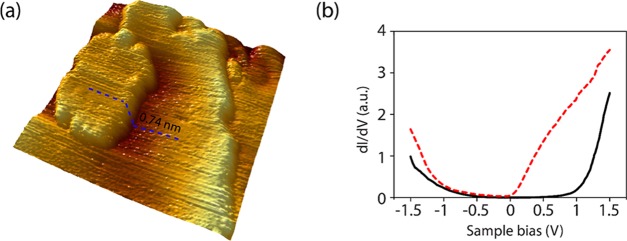
Figure 5.
(a) Three-dimensional (3D) image of HfSe2 surface after air exposure for 2 days. The blue dashed line profiles the flake height, It = 0.6 nA, Vs = −2.5 V; (b) dI/dV spectra of the oxidized surface (black curve) and pristine HfSe2 (red dashed curve) measured with the same STM tip, It = 0.4 nA, Vs = −1.5 V.

