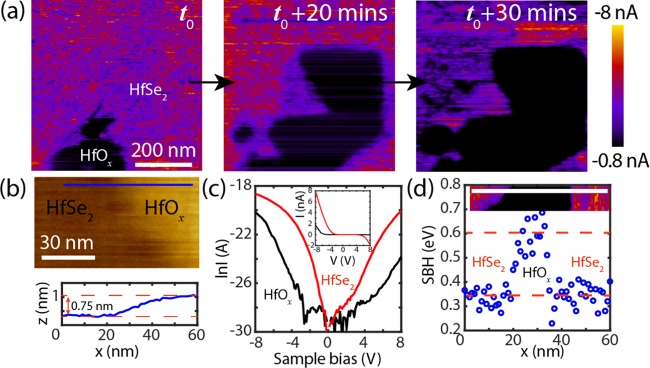
Figure 6.
(a) Oxidation evolution of HfSe2 as measured with C-AFM, which was taken at to, to + 20 min, and to + 30 min. The sample bias is 4.7 V. (b) AFM topography of the transition between an unoxidized and an oxidized region. The blue line shows the apparent height of the HfOx layer. (c) Semilogarithmic contact I(V) curves for HfSe2 and HfOx. Inset: the corresponding contact I(V) curves. (d) Schottky barrier height cross section showing a HfSe2–HfOx–HfSe2 transition.

