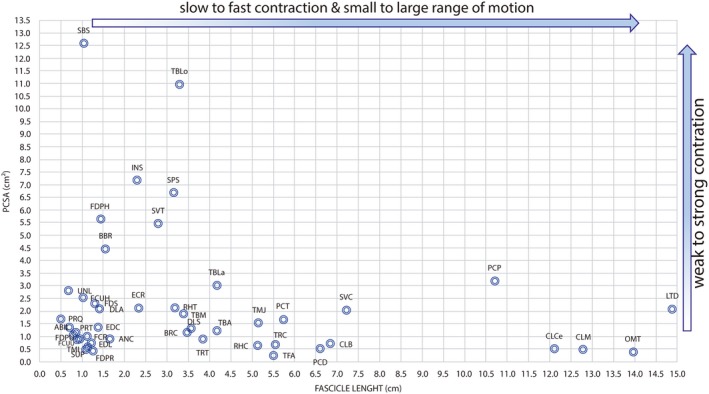
Figure 7.

Scatter graph showing fiber length and physiological cross‐sectional area (PCSA) of muscles in the human lower limb. Fiber length is proportional to muscle excursion, and PCSA is proportional to maximum muscle force. Thus, this graph can be used to compare relative force and excursion of muscles within the thoracic limb of adult specimens of Lycalopex gymnocercus (n = 8).
