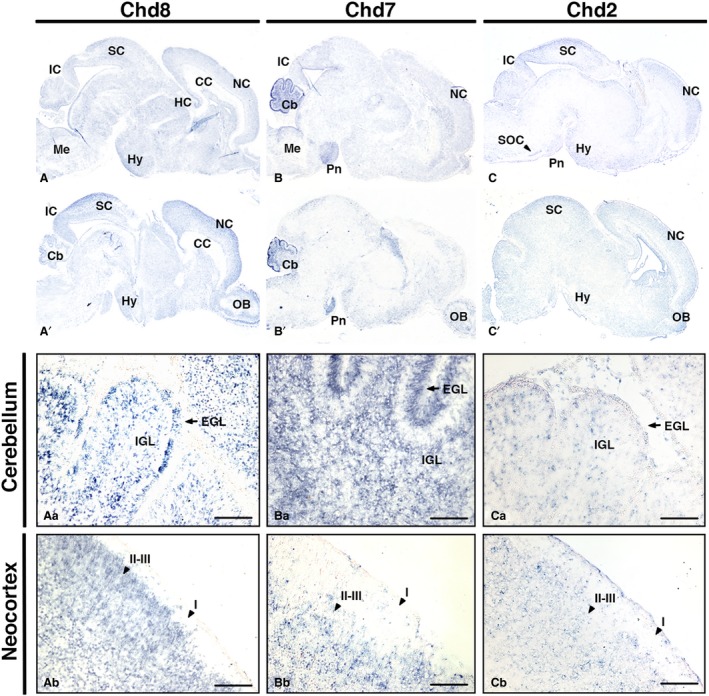
Figure 4.

Comparative Chd8, Chd7 and Chd2 expression patterns in the newborn mouse brain. Sagittal sections through newborn mouse brain (anterior to the right), hybridised with antisense RNA probes to detect Chd8 (A,A’), Chd7 (B,B’) and Chd2 (C,C’) transcripts in blue. Representative medial (top) and lateral (bottom) sections are shown for each. Note widespread expression of Chd8, highly localised Chd7 expression in the cerebellum and pons, and Chd2 in the neocortex, midbrain and cerebellum. High‐magnification views of the cerebellum (Aa–Ca) and neocortex (Ab–Cb) are shown. Scale bars: 100 μm. Cb, cerebellum; EGL, external granule cell layer; HC, hippocampus; Hy, hypothalamus; I, cortical layer I; II–III, cortical layers II–III; IC, inferior colliculus; IGL, internal granule cell layer; Me, medulla; NC, neocortex; OB, olfactory bulb; Pn, pons; SC, superior colliculus; SOC, superior olivary complex.
