
Figure 6.
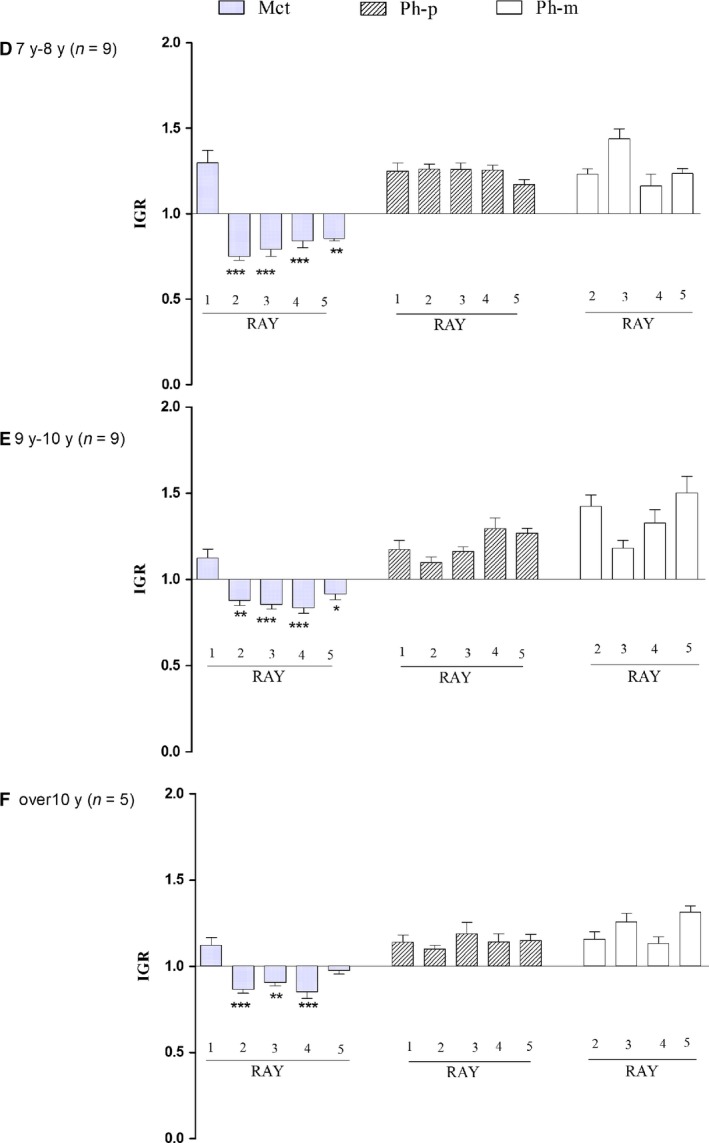
Proximal‐distal IGR) compared among R1–R5 metacarpals (Mtc), proximal phalanges (Ph‐p) and mid phalanges (Ph‐m) in age groups D–E. This parameter was not assessable in age groups A–C. With reference to IGR ≅ 1 corresponding to symmetric, bidirectional growth, the index was inverted at the passage from the 1st and the 2nd metacarpals with an evident relationship with the epiphyseal ossification center position (and later growth plate cartilage). Significant differences in proximal and mid phalanges (not reported in the histograms) but without inversion. *P < 0.05; **P < 0.01; *** P < 0.001 vs. R1 Mtc.