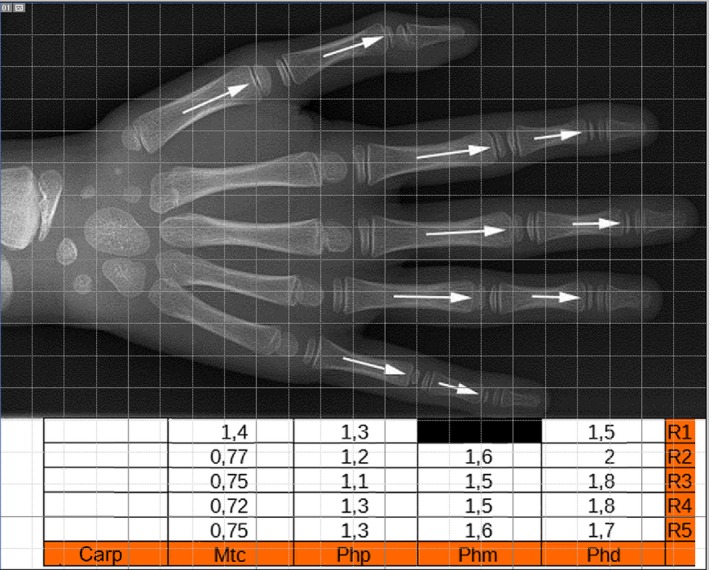
Figure 9.

(top) Image of the hand with the widest distribution of proximal and distal epiphyseal ossification centers, reported in two siblings by de Jong et al. (2014) and reproduced from The Journal of Hand Surgery with permission of Elsevier (licence no. 4280070488758). (bottom) Table reporting the IGR calculation of each hand segment.
