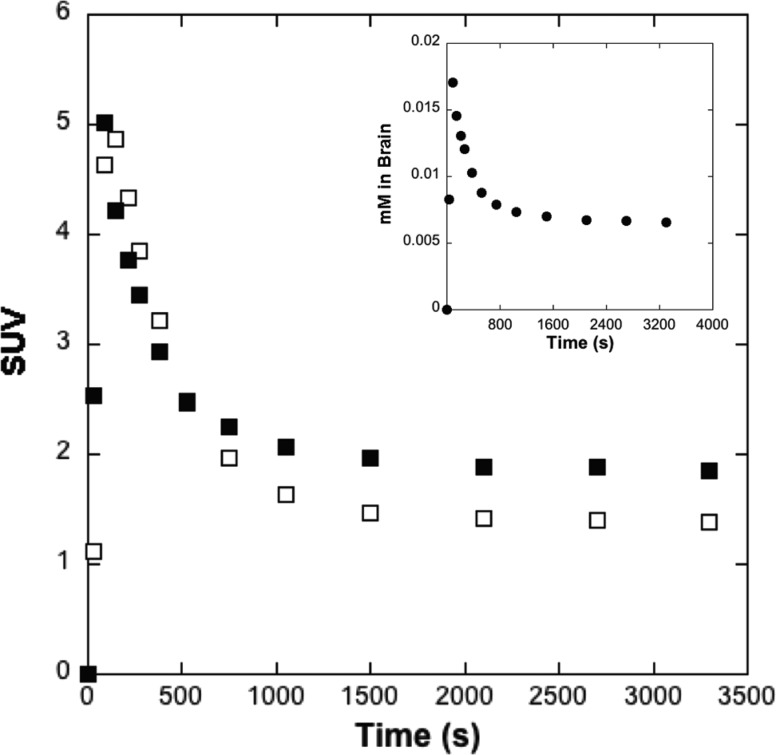
Figure 4.
Main panel: averaged (n = 2) rodent whole brain time-radioactivity curves (0–60 min post-iv-injection of high (259 GBq/μmol, □) and low (0.0185 GBq/μmol, ■) molar activity doses of [11C]1). Inset: whole brain concentration curve (0–60 min post-iv-injection of low (●) molar activity doses of [11C]1).

