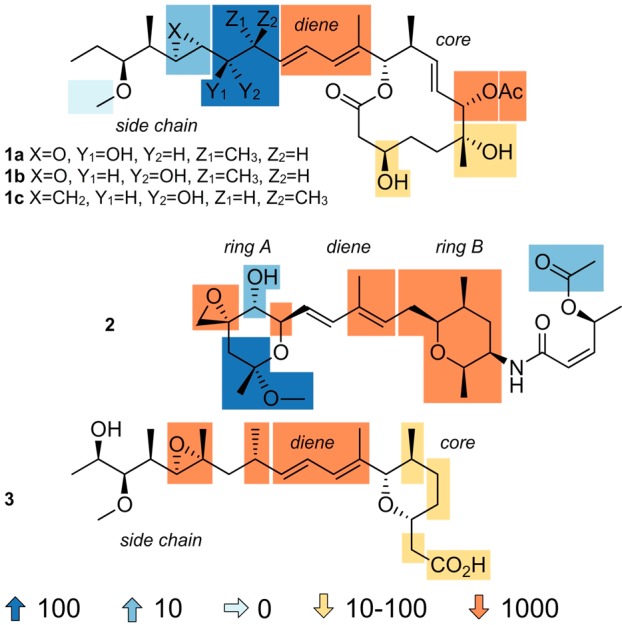
Figure 1.

Maps of the structure–activity relationship (SAR) data derived from cytotoxicity analyses (tumor cell GI50 values) on synthetic or semisynthetic derived SPLMs displayed with FD-895 (1a), 17S-FD-895 (1b), cyclopropane 1c, spliceostatin A (2), and herboxidiene (3). Chemical modifications either enhance (blue) or attenuate (orange) activity.
