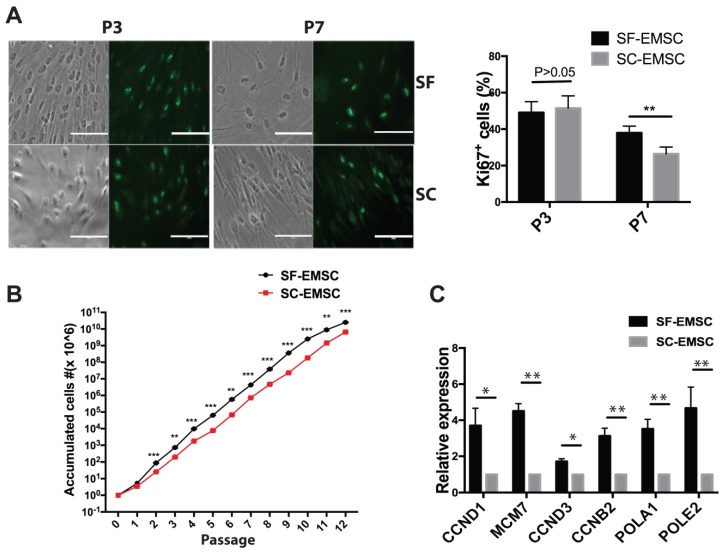
Figure 2.
Analyses of proliferation of SF- and SC-EMSC at various passages. (A) Immunofluorescent staining analyzed Ki67 expression in both SF- and SC-EMSC at passage 3 and 7. Bars, 100 μm. **P < 0.01. (B) The total number of cells recovered at each subsequent passage was calculated and plotted. **P < 0.01, ***P < 0.001. (C) The expression of cell cycle related genes and DNA replication related genes were analyzed by qPCR. Gene expression was normalized to the value for GAPDH.

