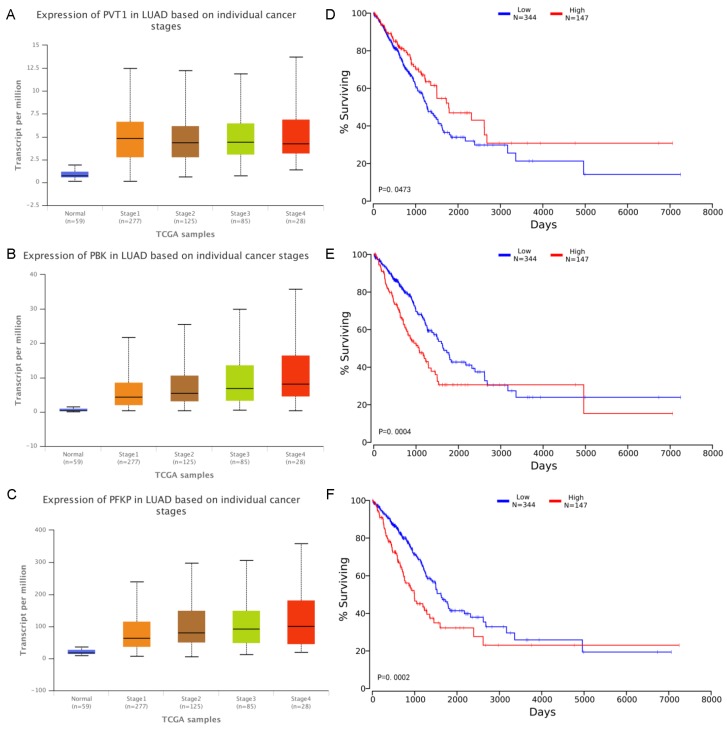
Figure 5.
A-C Expression of RNA on individual cancer stages. The x-axis indicates different pathological stages, and the five colors indicate normal, stage 1, stage 2, stage 3 and stage 4 respectively. The y-axis represents transcripts per million (TPM) of each RNA molecule. D-F Effects of RNA expression level on LUAD patient survival. The x-axis shows the patient's survival time, and the y-axis shows the Kaplan-Meier (KM) survival probability.

