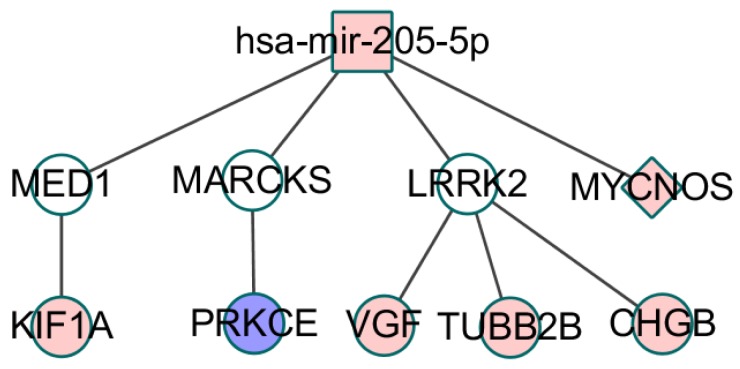
Figure 6.
CeRNA network constructed using module 9, the color of nodes represents the expression change of RNA compared to control samples, and Red (blue) indicates a significant increase (decrease). White node denotes these RNA is not in the co-module. Square node represents miRNA, circular node denotes mRNA and diamond node represents lncRNA. The edge denotes the relationship including regulation, co-expression, activation and inhibition between the two types of RNA.

