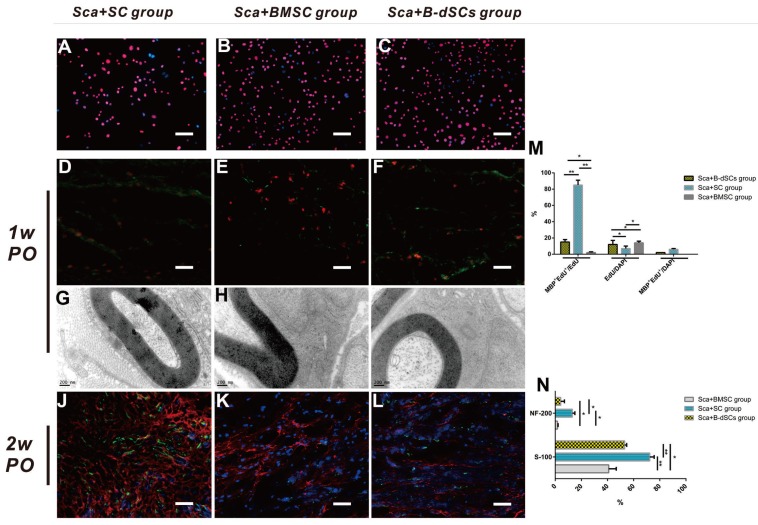
Figure 6.
The role of transplanted cells in the remyelination process. A-C Images of EdU-labeled cells cultured in vitro for transplantation. D-F In the first postoperative week, cell tracing reveals that the transplanted cells (red) in each group located at the midpoint of the graft express MBP (green). The quantification of the percentages of surviving EdU+ seed cells and cells expressing MBP is shown. G-I In the first postoperative week, TEM shows that the seed cells of the three groups form myelin sheath lamellae-like ultrastructures in the scaffold. J-L Comparison of the expression of S-100 (red) and NF-200 (green) at the midpoint of the graft in the three groups during the second postoperative week. The quantitative analysis of the expression levels in the three groups is shown. *P<0.05, **P<0.01, one-way ANOVA with Tukey's post hoc test. Scale bar=50 µm.

