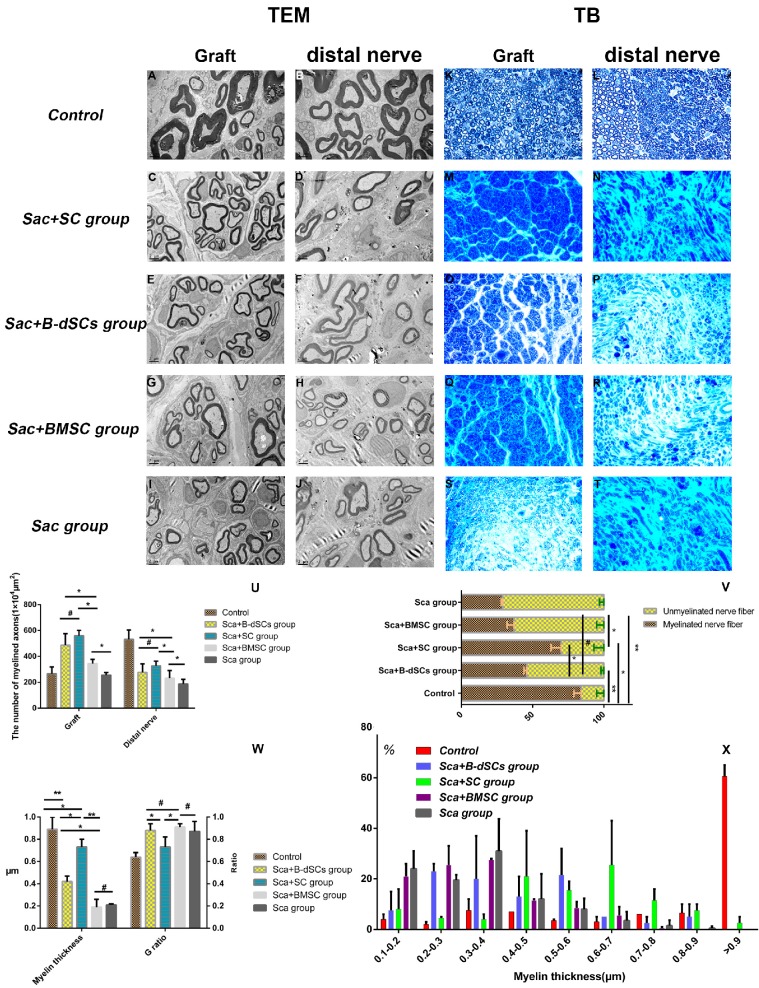
Figure 7.
Comparison of remyelination between groups. At 4 weeks after surgery, the midpoint of the graft and the distal nerve were examined using toluidine blue staining (K-T;400×) and TEM (A-J; bar=2μm). The results of statistical analyses comparing the number of regenerated myelinated/unmyelinated nerves (U), their ratios (V), the thickness of the regenerated myelin sheath, and the G-ratio (W) are shown. (X) Detailed distribution of the mean myelin sheath thickness in the midpoint of the graft and the distal nerve of the four groups. *P<0.05, **P<0.01, #P>0.05, one-way ANOVA with Tukey's post hoc test. Scale bar=200 μm.

