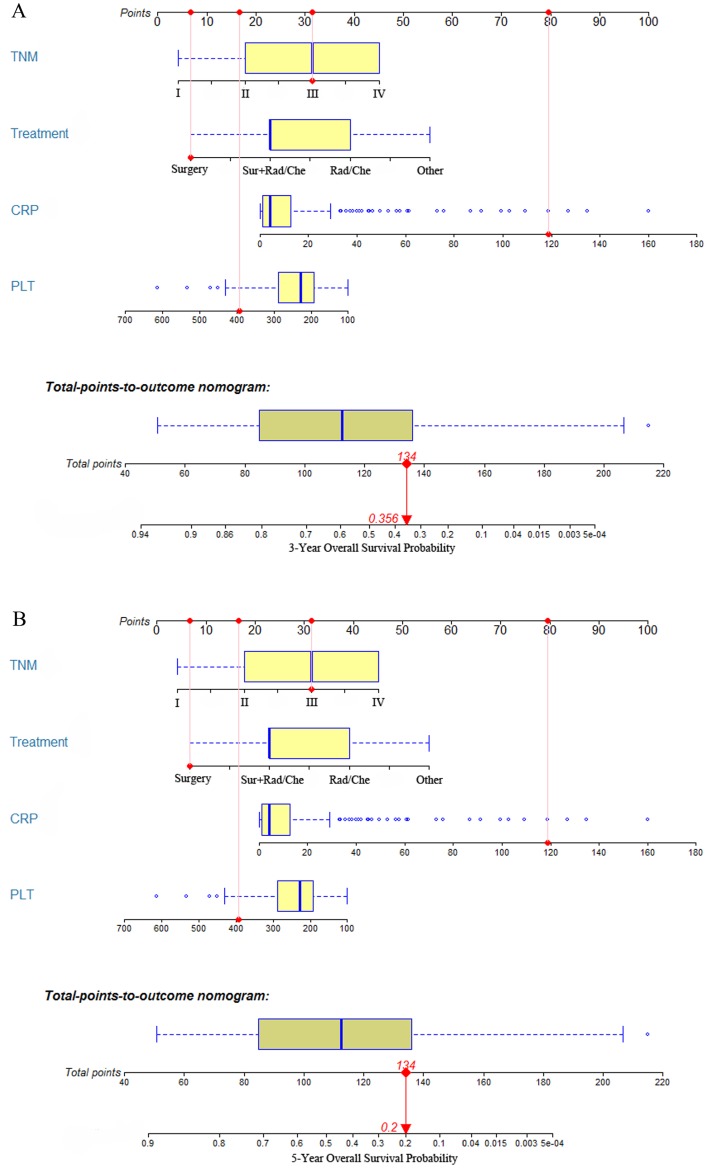
Figure 2.
The 3- and 5-year overall survival probability is calculated by taking the sum of the risk points, according to TNM stage, treatment, CRP, and PLT. For each parameter, the number of associated risk points can be determined by drawing a vertical line straight up from the covariate's corresponding value to the axis with risk points (0 to 100). In order to determine the 5-year overall survival probability, a vertical line is drawn intersecting the “Total points” with the corresponding survival line.

