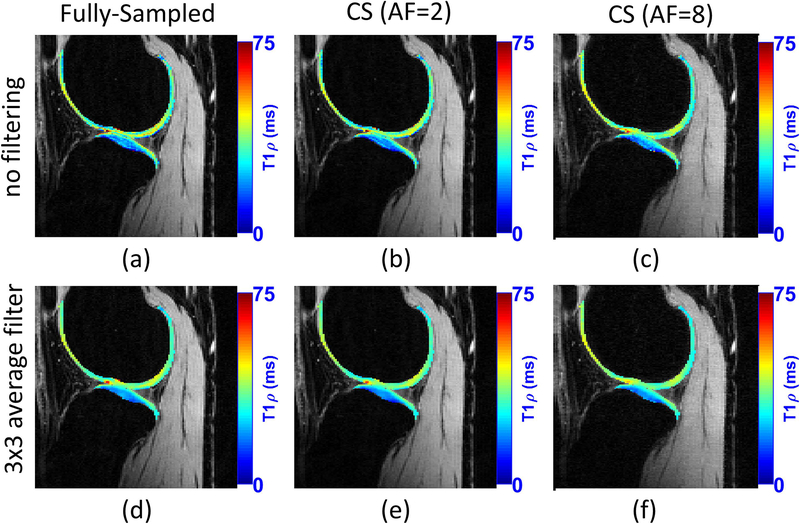
Figure 12:
A visual example of the acceleration provided by CS for T1ρ mapping of knee cartilage. CS method used Poisson disk pattern for sampling and L+S with sparsity in the spatial finite difference, as shown in (27). The use of filtering before fitting is also illustrated. Similarly, T1ρ maps of knee cartilage after filtering is much smoother.

