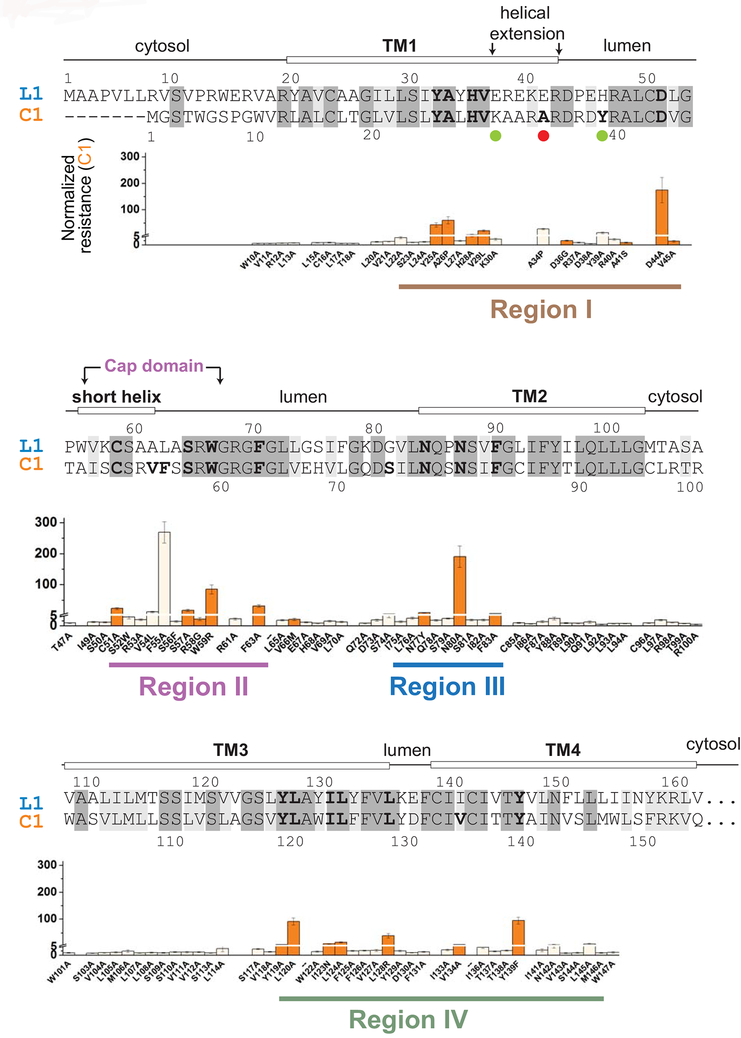
Figure 1. Mapping of WR mutations in VKORC1 with sequence alignment of VKORC1 (C1) and VKORL1 (L1).
Identical residues (48%) are shadowed in dark grey, and similar residues (26%) in grey. Prediction of secondary structures (top) are based on the crystal structure of a bacterial VKOR homolog [22]. Regions I–IV are identified (bottom) based on the distribution of WR mutations in VKORC1. The underlying panels show the resistant level of WRs in VKORC1 [15], with a Y-axis break at NRwar = 5. Residues with NRwar > 5 mutations are shown in bold letters in the sequence alignment. The orange-colored WR mutations in VKORC1 are selected for mutagenesis analysis of the corresponding residues in VKORL1 (Fig. 3A–C). Matching mutations (Fig. 4B) and the human SNP (Fig. 6) that increase the warfarin sensitivity of VKORL1 are indicated by green and red dots, respectively.

