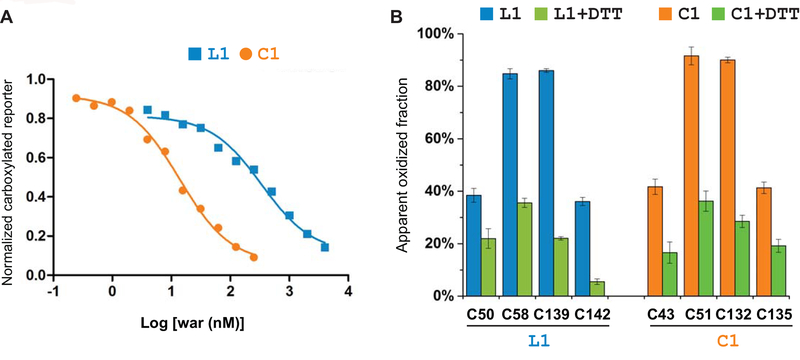
Figure 2. Different warfarin sensitivity of VKORL1 and VKORC1 is not owing to their redox-state change.
(A) Warfarin inhibition curves of VKORL1 and VKORC1. (B) Cellular redox status of conserved cysteines in VKORL1 (left) and VKORC1 (right), analyzed by MS-based footprinting before and after DTT reduction. Calculation of the error bars is described in Materials and Methods.

