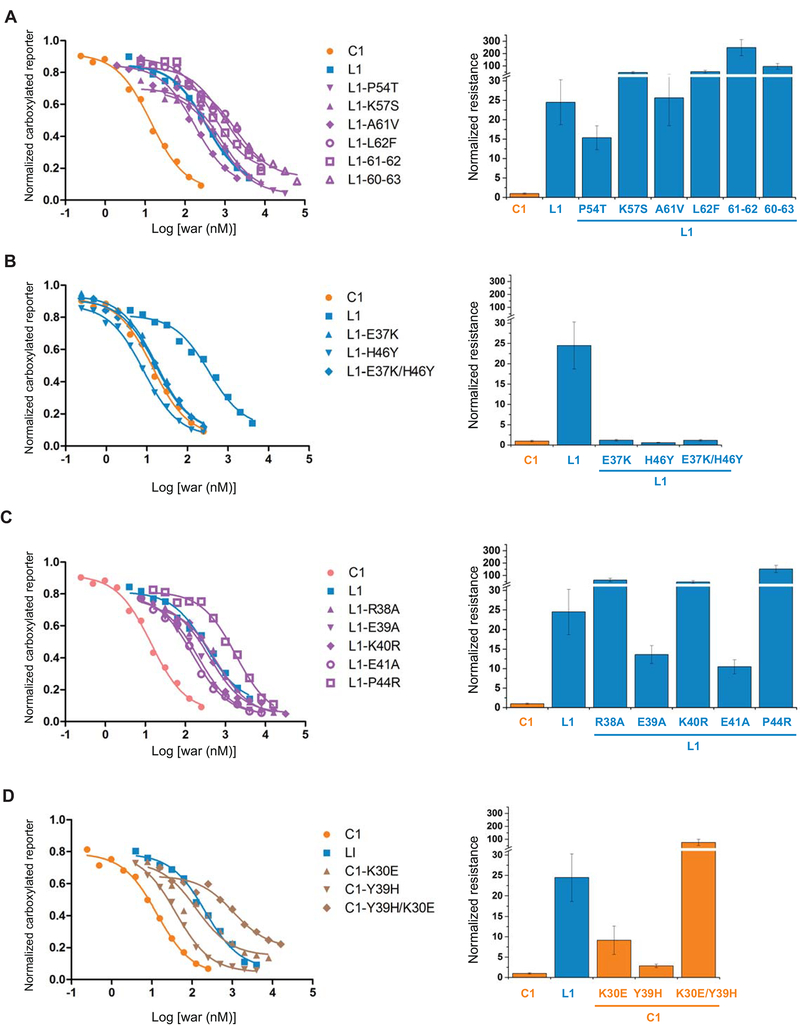
Figure 4. Region I determines the different warfarin sensitivity of VKORC1 and VKORL1.
Left: Inhibition curves of wild-type and mutant VKORC1 and VKORL1 (A–D). Right: relative resistance levels (A–D). The IC50s are normalized to that of the wild-type VKORC1. The error bars are s.e.m. with error propagation calculated for the normalization. (A) Matching mutations at region II. L1–61–62 stands for the double mutation of Ala61Val/Leu62Phe in VKORL1, and L1–60–63 stands for combined mutations of Ala60Arg/Ala61Val/Leu62Phe/Ala63Ser. (B) Matching mutations at region I that increase the warfarin sensitivity of VKORL1. (C) Other matching mutations at region I. (D) Corresponding mutations at the region I of VKORC1, which match with the VKORL1 sequence, confer warfarin resistance.

