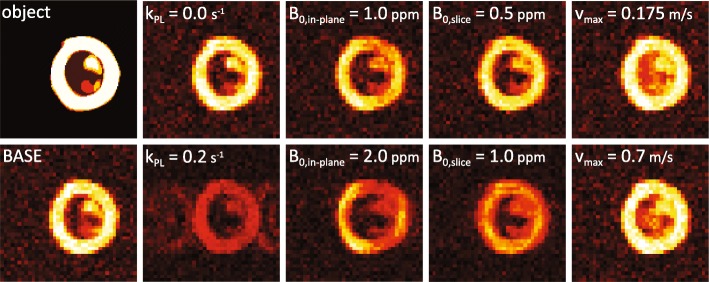
Fig. 2.
Simulated perfusion images at myocardial signal peak for signal-to-noise ratio (SNR) = 15. Effects of limited sampling resolution and variation of simulation parameters are illustrated. BASE case simulation values were: myocardial blood flow (MBF) = 2.5 mL/g/min, B0 in-plane = 0.25 ppm, B0 through-plane = 0.0 ppm, kPL = 0.0 s− 1, vmax = 0.35 m/s., flip-angle = 60°, in-plane resolution = 3 × 3 mm2, field-of-view 120 × 120 mm2

