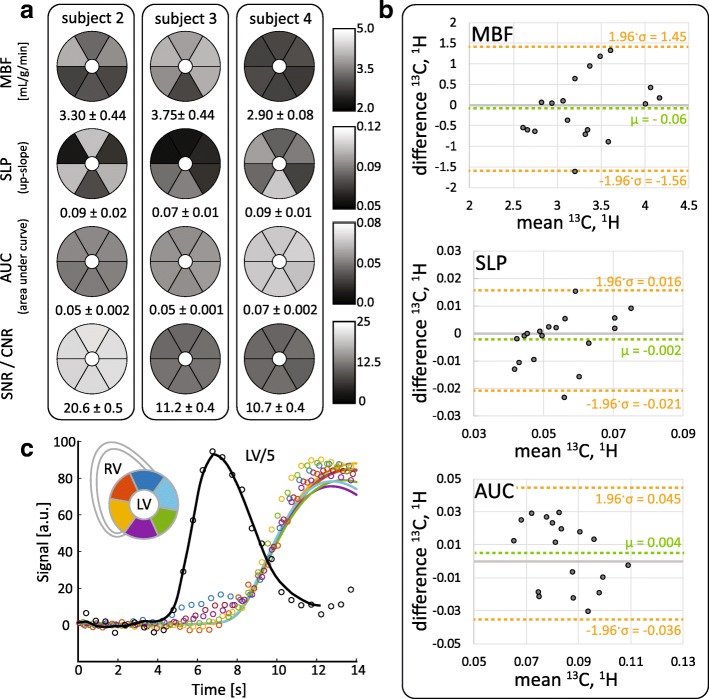
Fig. 9.
Summary of preliminary 1H gadolinium DCE validation data acquired in n = 3 subjects under the same stress condition as the 13C measurements. a Sector wise absolute and semi-quantitative perfusion indices and SNR for each 1H DCE measurement. Mean and standard deviation over all sectors are presented below the respective maps. b Comparison of sector-wise perfusion indices derived from dual-bolus 1H gadolinium DCE measurements and hyperpolarized 13C pyruvate measurements. c Exemplary perfusion curves acquired in subject 3. Raw data points are depicted with markers; solid lines show the calculated tissue response for the fitted Fermi function

