
Fig. 2.
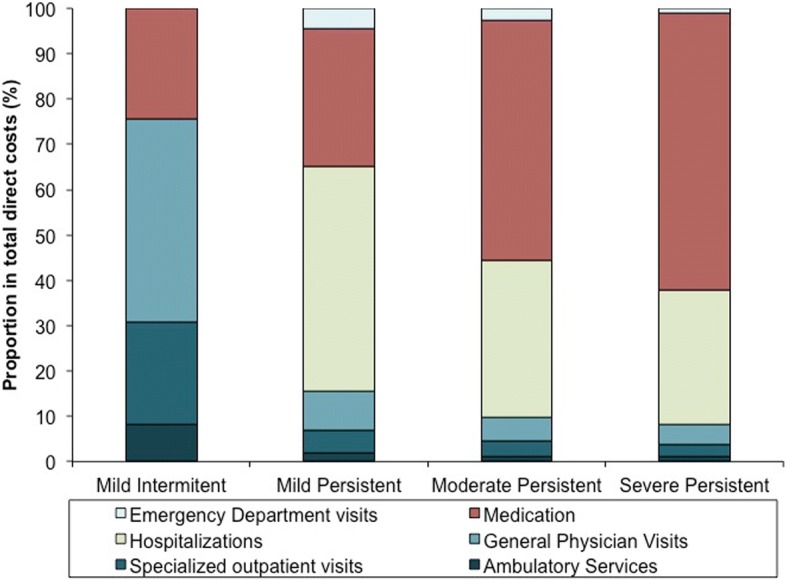
Distribution of total direct costs according to asthma severity. Cumulative percentage of total cost per category of severity among the different cost components
Official websites use .gov
A
.gov website belongs to an official
government organization in the United States.
Secure .gov websites use HTTPS
A lock (
) or https:// means you've safely
connected to the .gov website. Share sensitive
information only on official, secure websites.
Distribution of total direct costs according to asthma severity. Cumulative percentage of total cost per category of severity among the different cost components