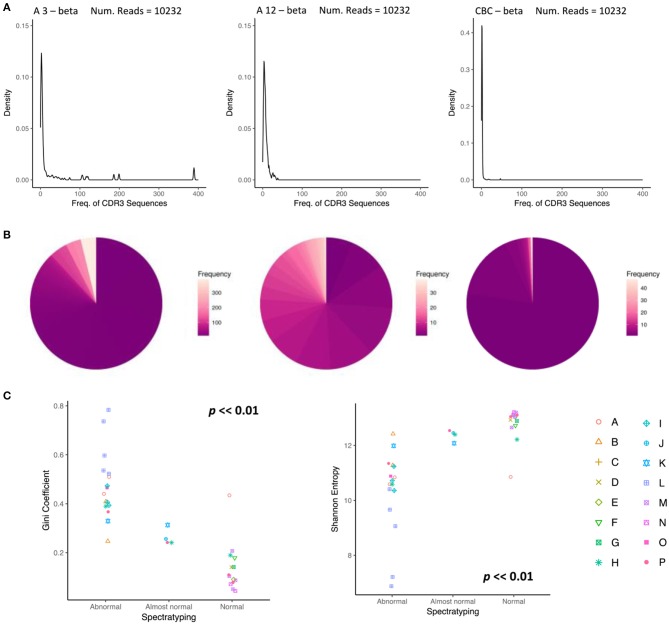
Figure 5.
Changes in the abundance profile of CDR3 sequences reflect normalization of the repertoire. (A) A density plot showing the distribution of abundances for the beta chain of CBT patient A, (left), 3 months after transplant, classified as abnormal by spectratyping, (middle) 12 months after transplant, classified as normal by spectratyping, (right) and a control cord. At month 3, CDR3 frequency density profile is highly abnormal with an overrepresentation of clonal expansions. By month 12, the repertoire becomes much more even reflecting a shift back towards normality. (B) A pie chart reflecting the same clonotype expression profile as (A), where color represents clonotype frequency. (C) TCR repertoire diversity reproduces the repertoire classification determined by spectratyping. Gini coefficient (left) and Shannon entropy (right) for each sample is plotted in relation to spectratyping classification.

