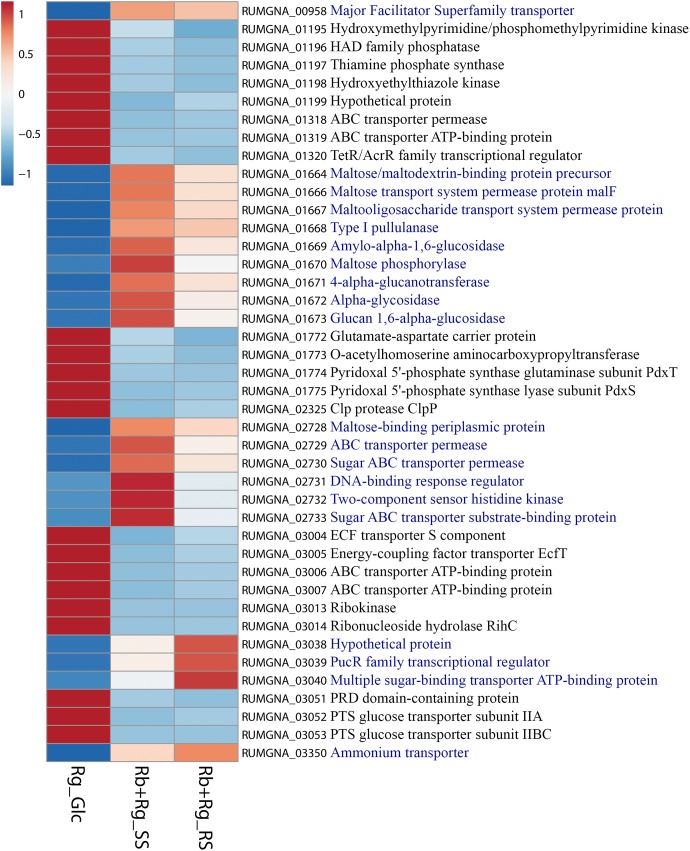
FIGURE 8.
Heatmap of the transcription level (in arbitrary unit) of selected differentially expressed (Log2 Fold Change < –1.5 or > 1.5 and padj < 0.05) R. gnavus ATCC 29149 genes in different growth conditions. This heatmap was produced with ClustVis web tool (Metsalu and Vilo, 2015) using the transcript counts as input values. The 20 R. gnavus ATCC 29149 genes with an upregulated transcription in both co-cultures with R. bromii L2-63 on starch compared to the mono-culture on Glc are in blue. The 22 R. gnavus ATCC 29149 genes with an upregulated transcription in the mono-culture on Glc compared to both co-cultures with R. bromii L2-63 on starch are in black.

