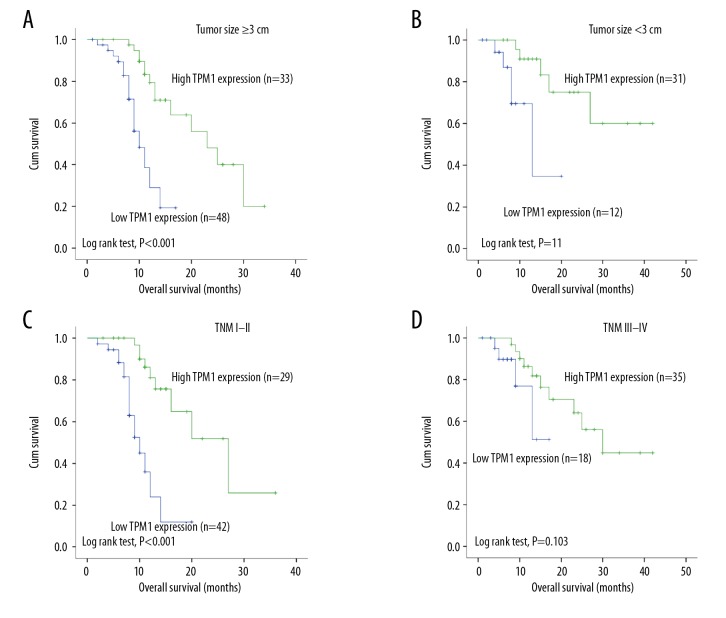
Figure 4.
Subgroup survival analysis of TPM1. (A, B) Patients with high TPM1 expression had a better OS, not only in the size ≥3 cm group (P<0.001), but also in the size <3 cm group (P=0.011). (C, D) Patients with high TPM1 expression had a better OS in stages III–IV (P<0.001), but not in stages I–II (P=0.103).

