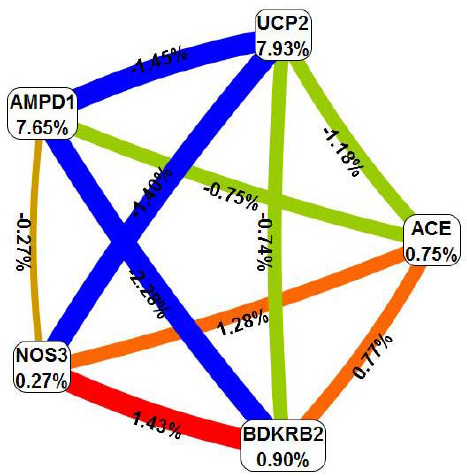
Figure 1.

Interaction map using entropy-based measure of information gain. Percentages indicate the amount of entropy removed by each polymorphism and each pairwise combination of polymorphisms. Positive values (orange, red lines) reflect synergistic interaction, negative values (blue, green lines) indicate redundancy. Near zero values (brown line) indicate independence.
