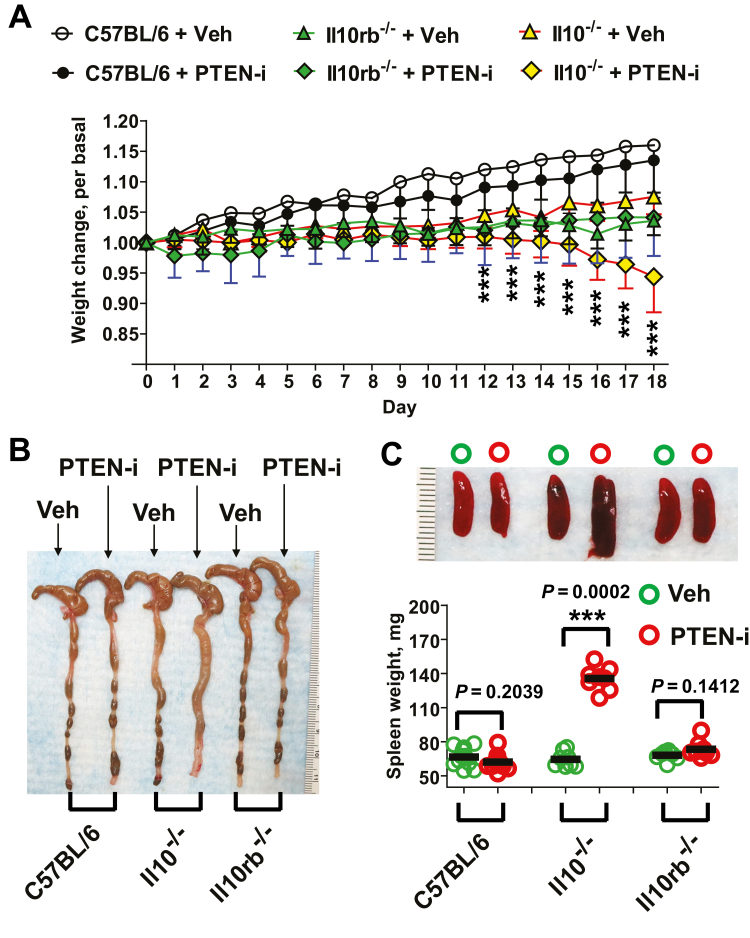
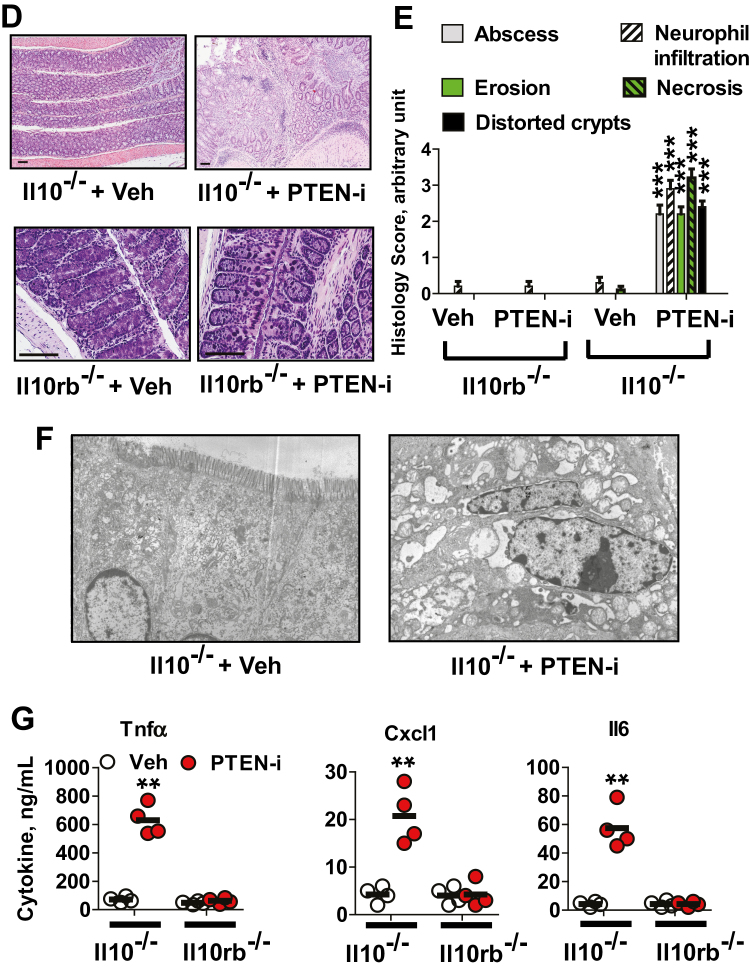
FIGURE 2.
PTEN inhibitor treatment elicits colitis in Il10-/- mice, but not in Il10rb-/- or C57BL/6 mice. A, Age- and sex-matched Il10-/-, Il10rb-/-, and C57BL/6 mice were treated with intracolonic administration of PTEN inhibitor (PTEN-i) VO-OHpic (5 mM/kg) and vehicle (Veh, 5% DMSO), given once every day during the experimental period. Body weight change was evaluated as previously described.13, 68 Results are means ± SD, C57BL/6 (PTEN-i group, n = 12; Vehicle group, n = 12), Il10rb-/- (PTEN-i, n = 7; Vehicle, n = 9), Il10-/-, (LPS, n = 8; Vehicle, n = 8). Data were compared by 2-way ANOVA (with treatment and times) followed by the multiple-comparison Bonferroni t test to assess differences between groups. ***Difference from PTEN-i-treated Il10-/- mice vs vehicle-treated Il10-/- mice at that time (P < 0.001). Data were analyzed with the results accumulated by 6 independent experiments. B, Gross appearance of the colon and cecum from these mice was compared. C, Presented is the gross appearance of the spleen obtained from the mice (upper panel). The spleen weight was measured and compared (lower panel). ***P < 0.001 (Mann-Whitney U test). D, Full length of the colon was prepared in a “swiss roll” method and subjected to H&E staining (scale bars, 100 μm). E, Histological parameters were quantified with H&E sections (n = 10/group). F, Electron micrographs of the colonic epithelium from Il10-/- mice treated with PTEN-i or vehicle. G, The total protein was extracted from the mouse colon, followed by ELISA to measure the level of Tnfα, Cxcl1, and Il6 production. Data were expressed as mean ± SEM (n = 4 mice per group, each with triplicate determinations). **P < 0.01 (Mann-Whitney U test). Representative images are presented.


