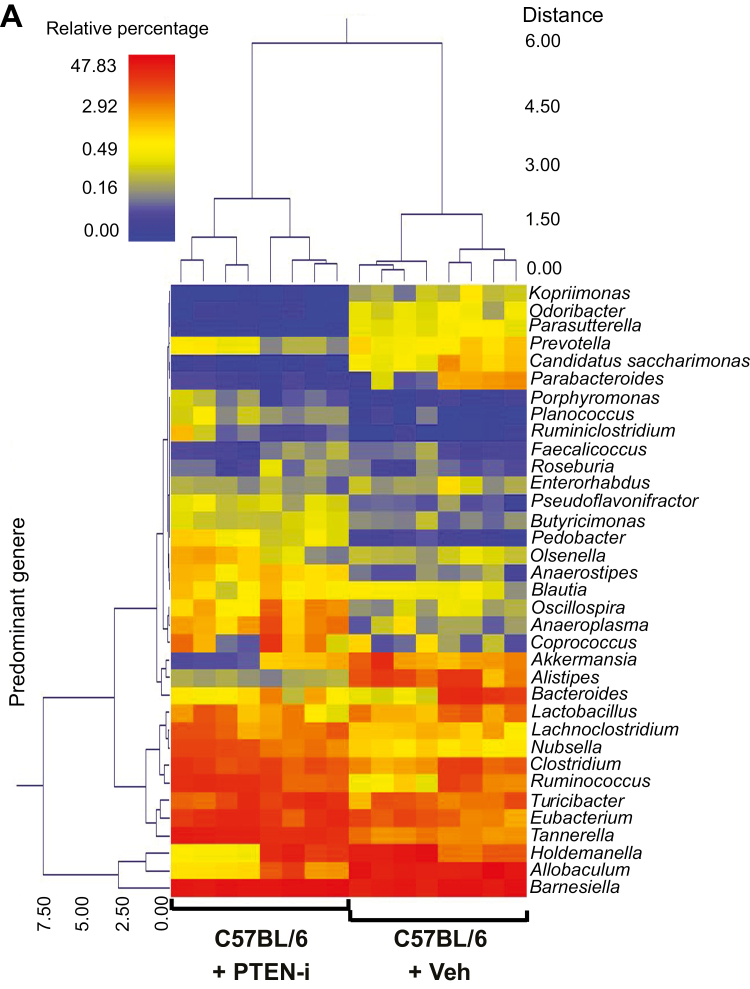
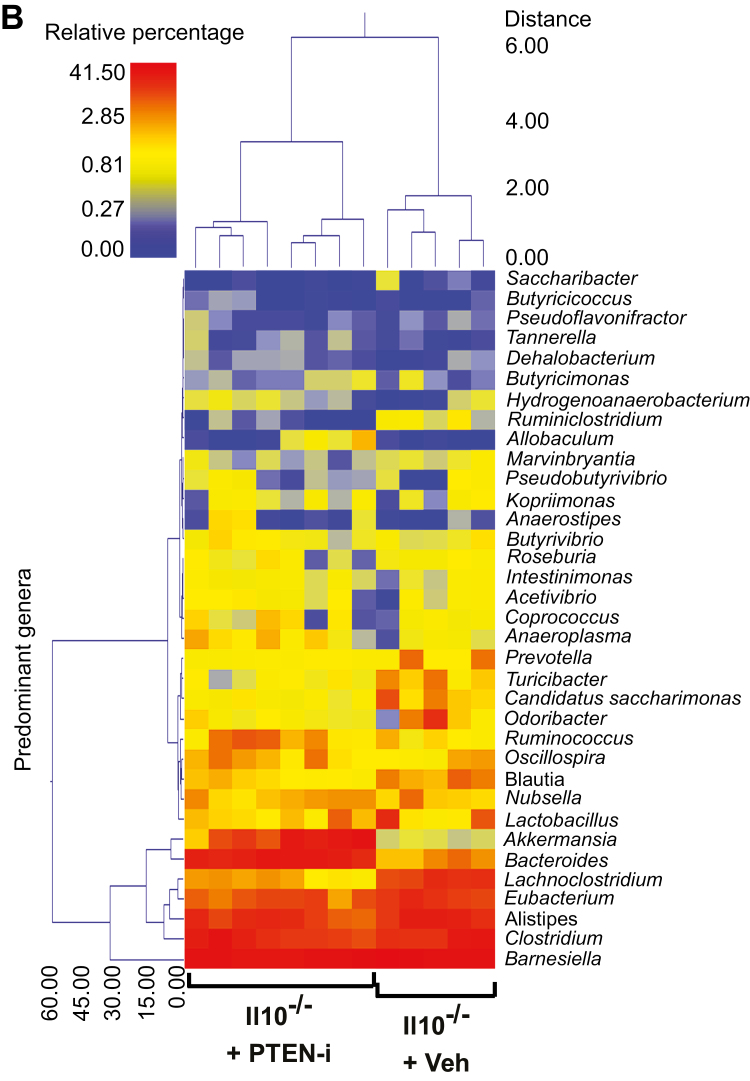
FIGURE 5.
PTEN-i treatment altered fecal microflora in C57BL/6 and Il10-/- mice. (A and B), Based on the predominant genera using Ward’s minimum variance clustering and Manhattan distances, a dual hierarchal dendrogram was constructed. Samples were clustered along the x axis, labeled by the treatment in C57BL/6 (A) and Il10-/- mice (B). Samples with more similar microbial populations are mathematically clustered closer together. The genera (consortia) are used for clustering. Thus, the samples with more similar consortia of genera cluster closer together, with the length of connecting lines (top of heat map) related to the similarity. Shorter lines between 2 samples indicate closely matched microbial consortia. The heat map represents the relative percentages of each genus. The predominant genera are represented along the right y axis. The legend for the heat map is provided in the upper left corner.


