
Figure 2.
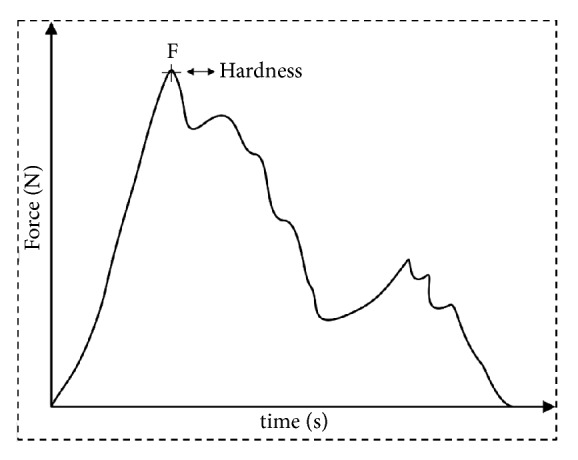
Typical curve of force (N) versus time (s) showing the maximum compression force used for describing the snack texture.
Official websites use .gov
A
.gov website belongs to an official
government organization in the United States.
Secure .gov websites use HTTPS
A lock (
) or https:// means you've safely
connected to the .gov website. Share sensitive
information only on official, secure websites.
Typical curve of force (N) versus time (s) showing the maximum compression force used for describing the snack texture.