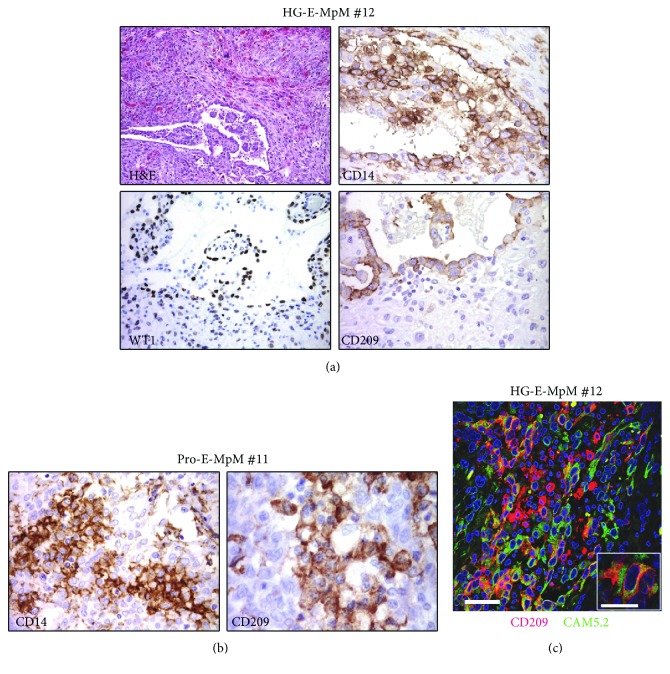
Figure 6.
Epithelial cancer cells positive for myeloid related markers. (a) IHC images showing a residual area of HG-E-MpM (no. 12). The tumour cells were positive for WT1, and in the same area, cells with a frankly tumoural phenotype stained positive for the myeloid markers CD14 and CD209. (b) Small clusters of cells that are morphologically consistent with tumoural cells were positive for CD14 and CD209 in Pro-E-MpM no. 11. (c) Double IF immunostaining and confocal analysis of CD209 (red) and tumour-associated cytokeratin CAM5.2 (green) in HG-E-MpM (no. 12). Representative images of their coexpression in residual epithelioid featuring tumoural cells. Scale bars = 50 μm and =5 μm for the lower and higher magnification, respectively.

