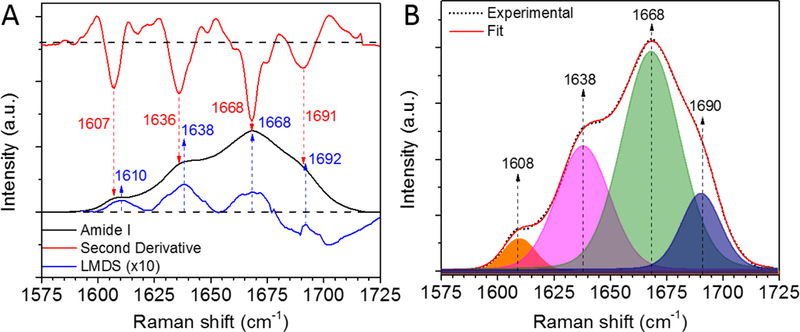
Figure 1.

Sub-band analysis of Amide I. To determine which one is most sensitive to sugar-mediated changes in the shape of the Amide I band, identification of sub-peak peaks involved 3 methods: (A) second derivative and local maxima of difference spectrum (LMDS) and (B) band fitting (deconvolution). Before the sub-band analysis, each spectrum was de-noised using a proprietary de-noising (D-n) algorithm provided by the LabSpec software to ensure no artificial peaks due to the noise were identified. LMDS intensity was multiplied by 10 for clarity.
