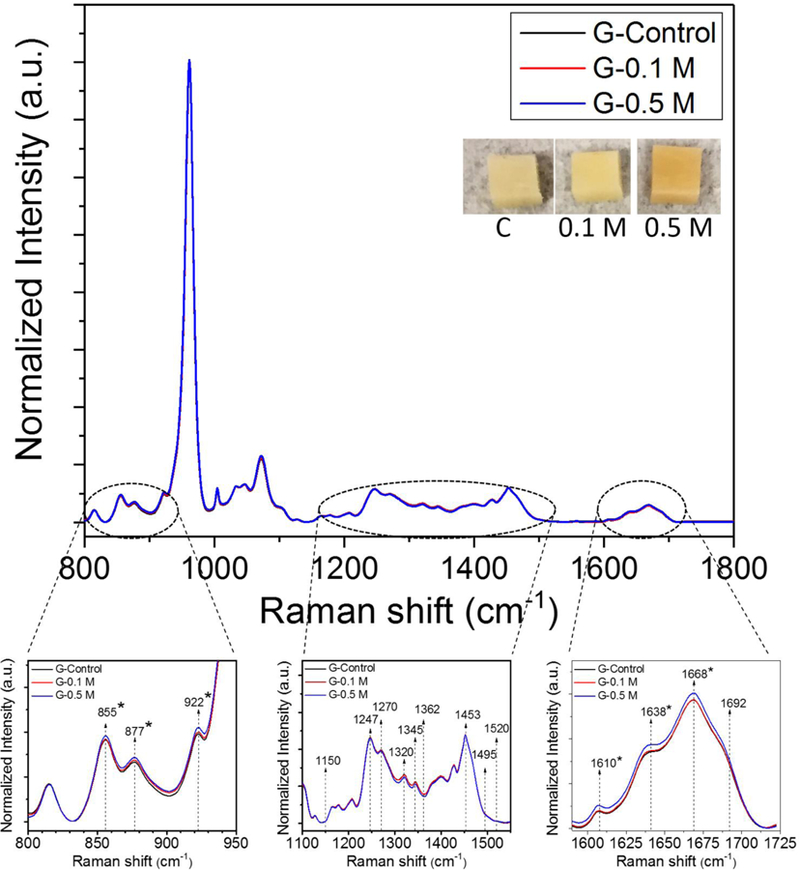
Figure 3.

Comparison of the averaged Raman spectra across glucose incubated groups. Raman spectra were normalized to phosphate peak located at ~ 960 cm-1. * indicates significant differences in Raman intensities between control and 0.5 M ribose incubation groups as determined by Mann-Whitney U tests at each wavenumber.
