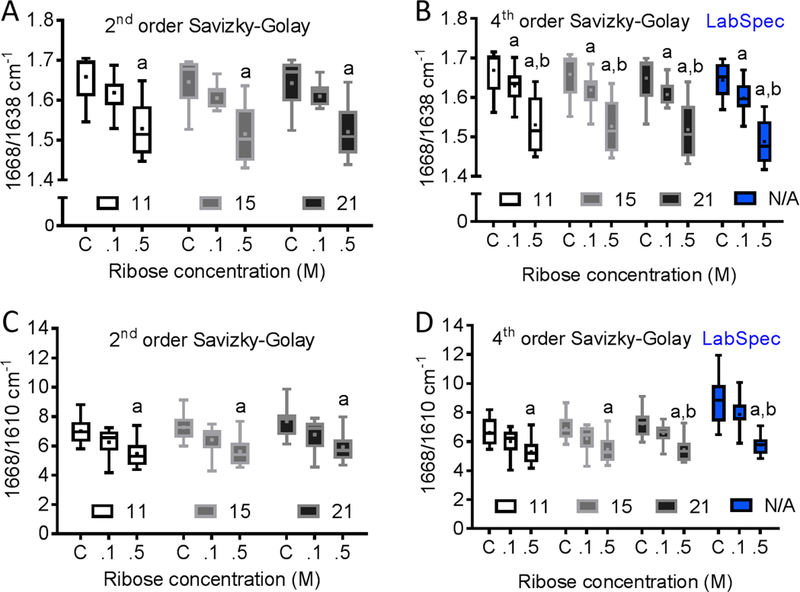
Figure 4.

Effect of different de-nosing/smoothing techniques on sensitivity of Raman spectroscopy to ribose-mediated changes in the sub-peaks of the Amide I band. We used either 2nd or 4th order Savizky-Golay (S-G) filters with 11, 15 and 21 window sizes along with Lab-spec de-noising (D-n) algorithm. (A) Regardless of the window size used, 2nd order S-G detected differences in 1668/1638 ratio between R-control and R-0.5. (B) Regardless of the window size used, the 4th order S-G and D-n further detected differences in 1668/1638 ratio between R-control and R-0.1. (C) The 2nd order S-G also detected differences in 1668/1610 ratio between R-control and R-0.5. (D) Increasing the window size of the 4th order S-G to 21 improved the ability to detect a significant difference in 1668/1610 between R-0.1 and R-0.5.
