
Figure 3.
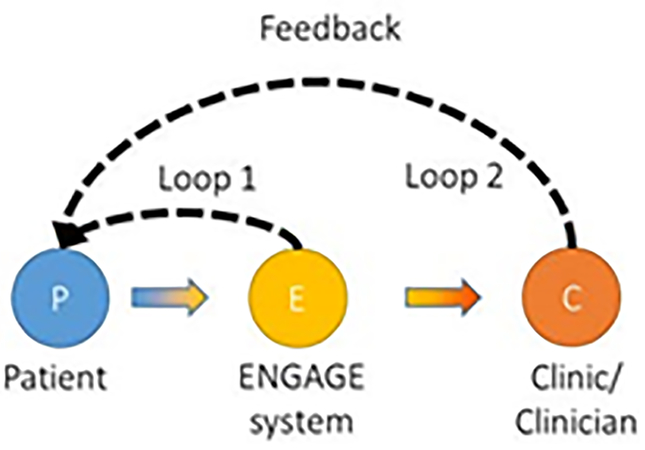
Representation of the concept of feedback loops in Engage, taken from a design summary document. Loop 1 represents the patient’s clinician-independent use of Engage and Loop 2 depicts a clinician’s involvement in patient’s self-care based on data patients log in Engage.