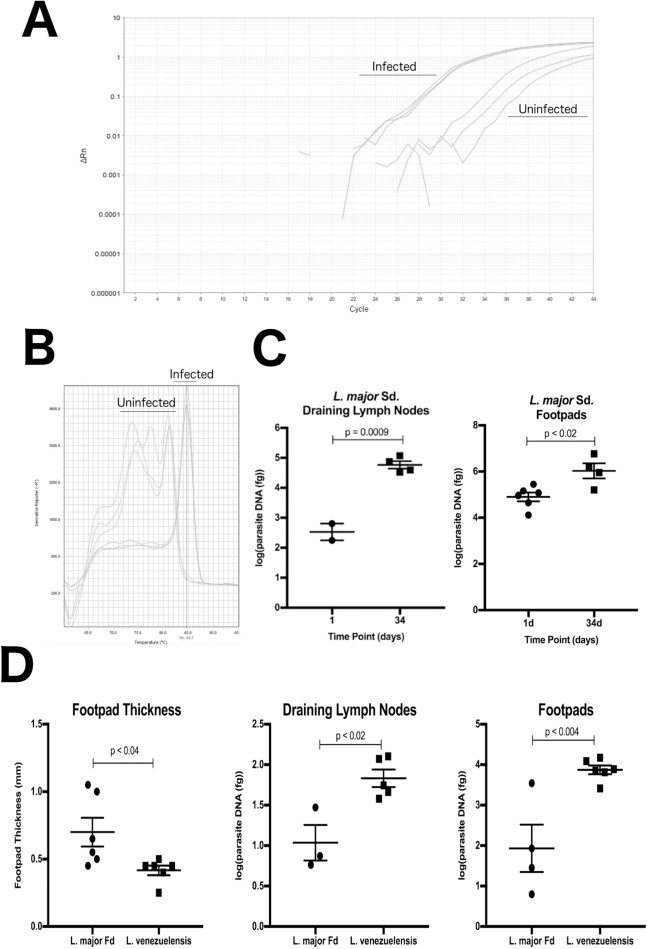
Figure 2. DRBD3 primers are able to assess parasite burden from infected mouse tissue.
(A and B) Representative amplification plots and melt curve analysis from the draining lymph nodes of mice at 34 days post infection. Parasites amplified from infected tissue had melting temperatures corresponding with the expected 84.7 °C. DNA from uninfected tissue resulted in non-specific amplification at later cycles with melt temps outside of 84.7 ± 0.5 °C. Samples that generated any product outside of this range were classified as having no Leishmania specific amplification. (C) Quantification of total parasites in the draining popliteal lymph nodes and infected footpads at 1 and 34 days post infection with L. major Seidman (Sd.). At 1 day post infection, five lymph node samples had no Leishmania specific amplification and are not plotted. All samples from 34 days post infection had detectable Leishmania specific amplification. (D) DRBD3 quantification provides insights to disease pathogenesis in L. major Freidlin (Fd.) and L. venezuelensis infections. Comparison of footpad thickness and parasite burden in the draining lymph nodes and infected footpads at 36 days post infection. Four lymph node samples and one footpad samples had no Leishmania specific amplification and are therefore not plotted. P-values calculated by parametric Students T-test.

